Q2 2024 Lincoln Private Market Index
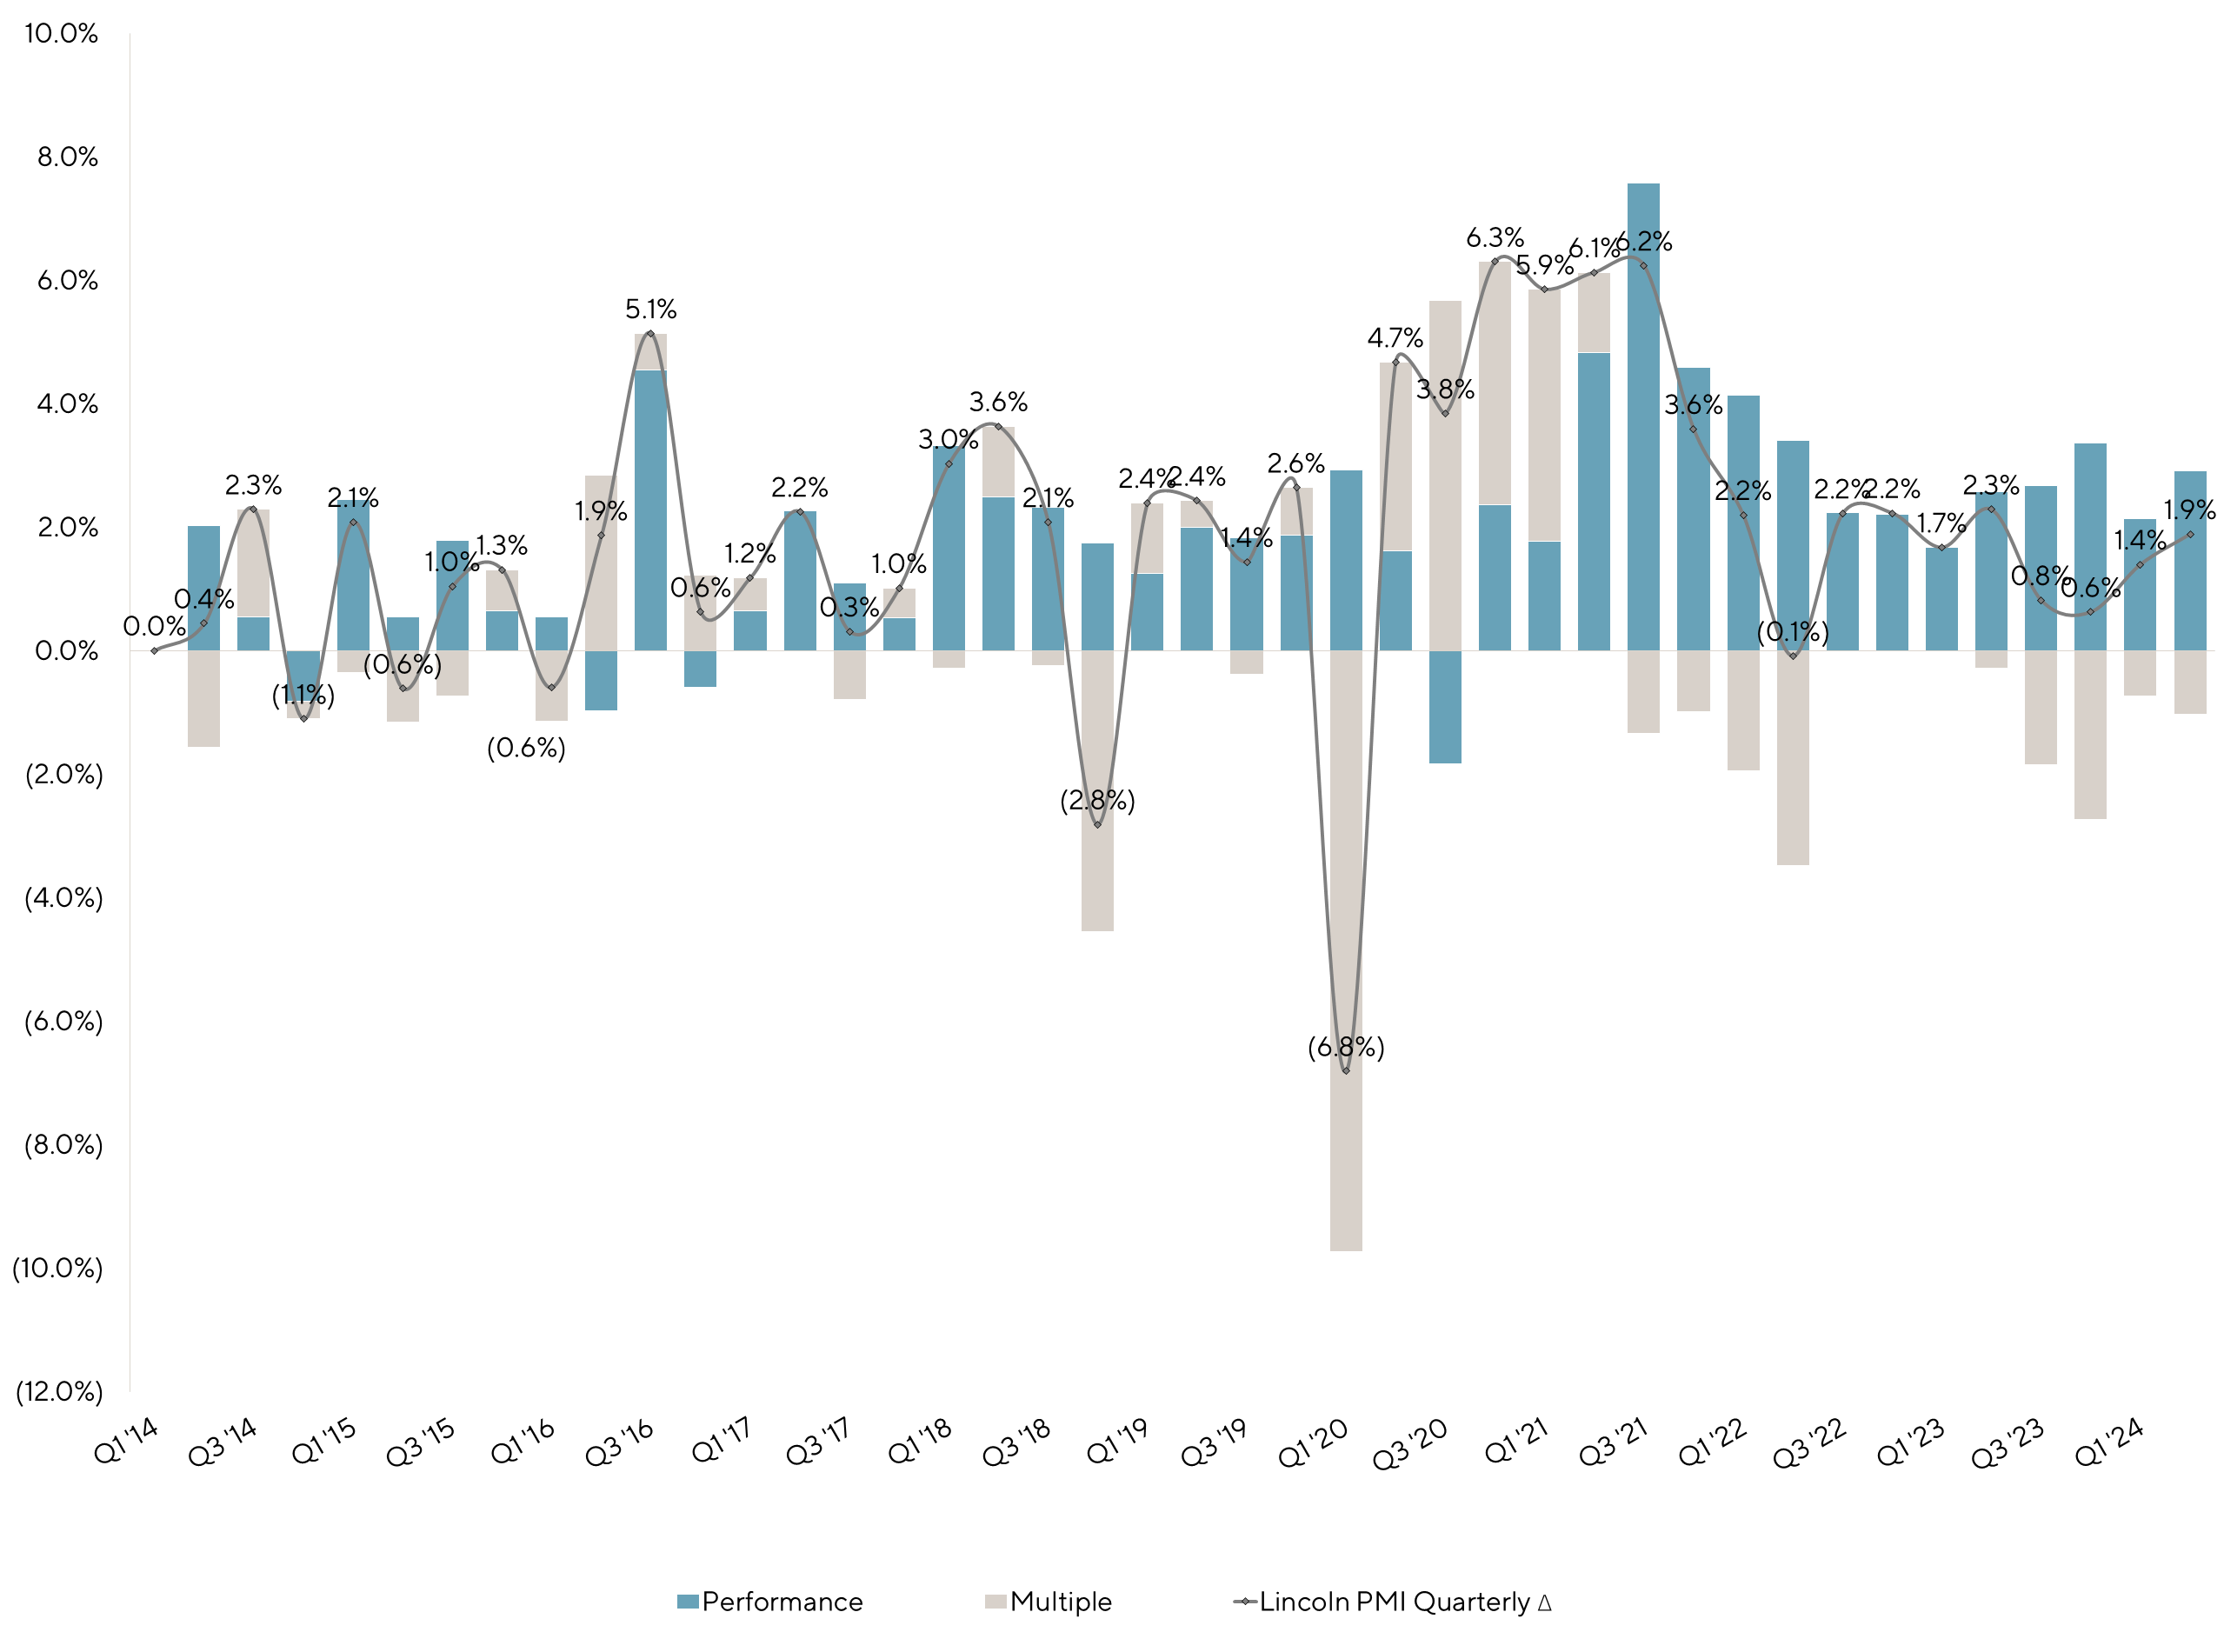
While the Lincoln Private Market Index Increased in the Second Quarter, Private Company Earnings Growth SlowedThe Lincoln Private Market Index (LPMI), the only index that tracks changes in the enterprise value of U.S. privately held companies, increased by 1.9% during the second quarter of 2024 as the index reached a new high. For both the Lincoln PMI and S&P 500, growth was largely driven by improved performance offset by some multiple contraction. About the Lincoln Private Market IndexThe LPMI is the only index measuring changes in the enterprise values of private companies over time – and a barometer of the performance of private companies generally. The Lincoln PMI enables private equity firms and other investors to benchmark how private company investments are performing against peers, and how this performance correlates to the S&P 500. Lincoln designed the LPMI to solve this problem by measuring the quarterly change in EVs for private companies primarily owned by PE firms. EV is the sum of a company’s equity value and debt. To review the results of an independent study on the quality and breadth of Lincoln’s private market database, click here. |
-
Quarterly Overview
- IMPORTANT DISCLOSURE
- 28th Edition: Covers Q2 2024
- Measures quarterly changes in the enterprise values of ~1,500 private companies, based on a population of ~5,500+ companies primarily owned by private equity firms with a median EBITDA of ~$40-45 million
- Analyzes the impact from the change in company earnings versus market valuation multiples
- Assess the change in value for six industry sectors
- Click here to download a printable version of this report.
Results
Lincoln PMI’s enterprise value growth was steady amidst public market volatility
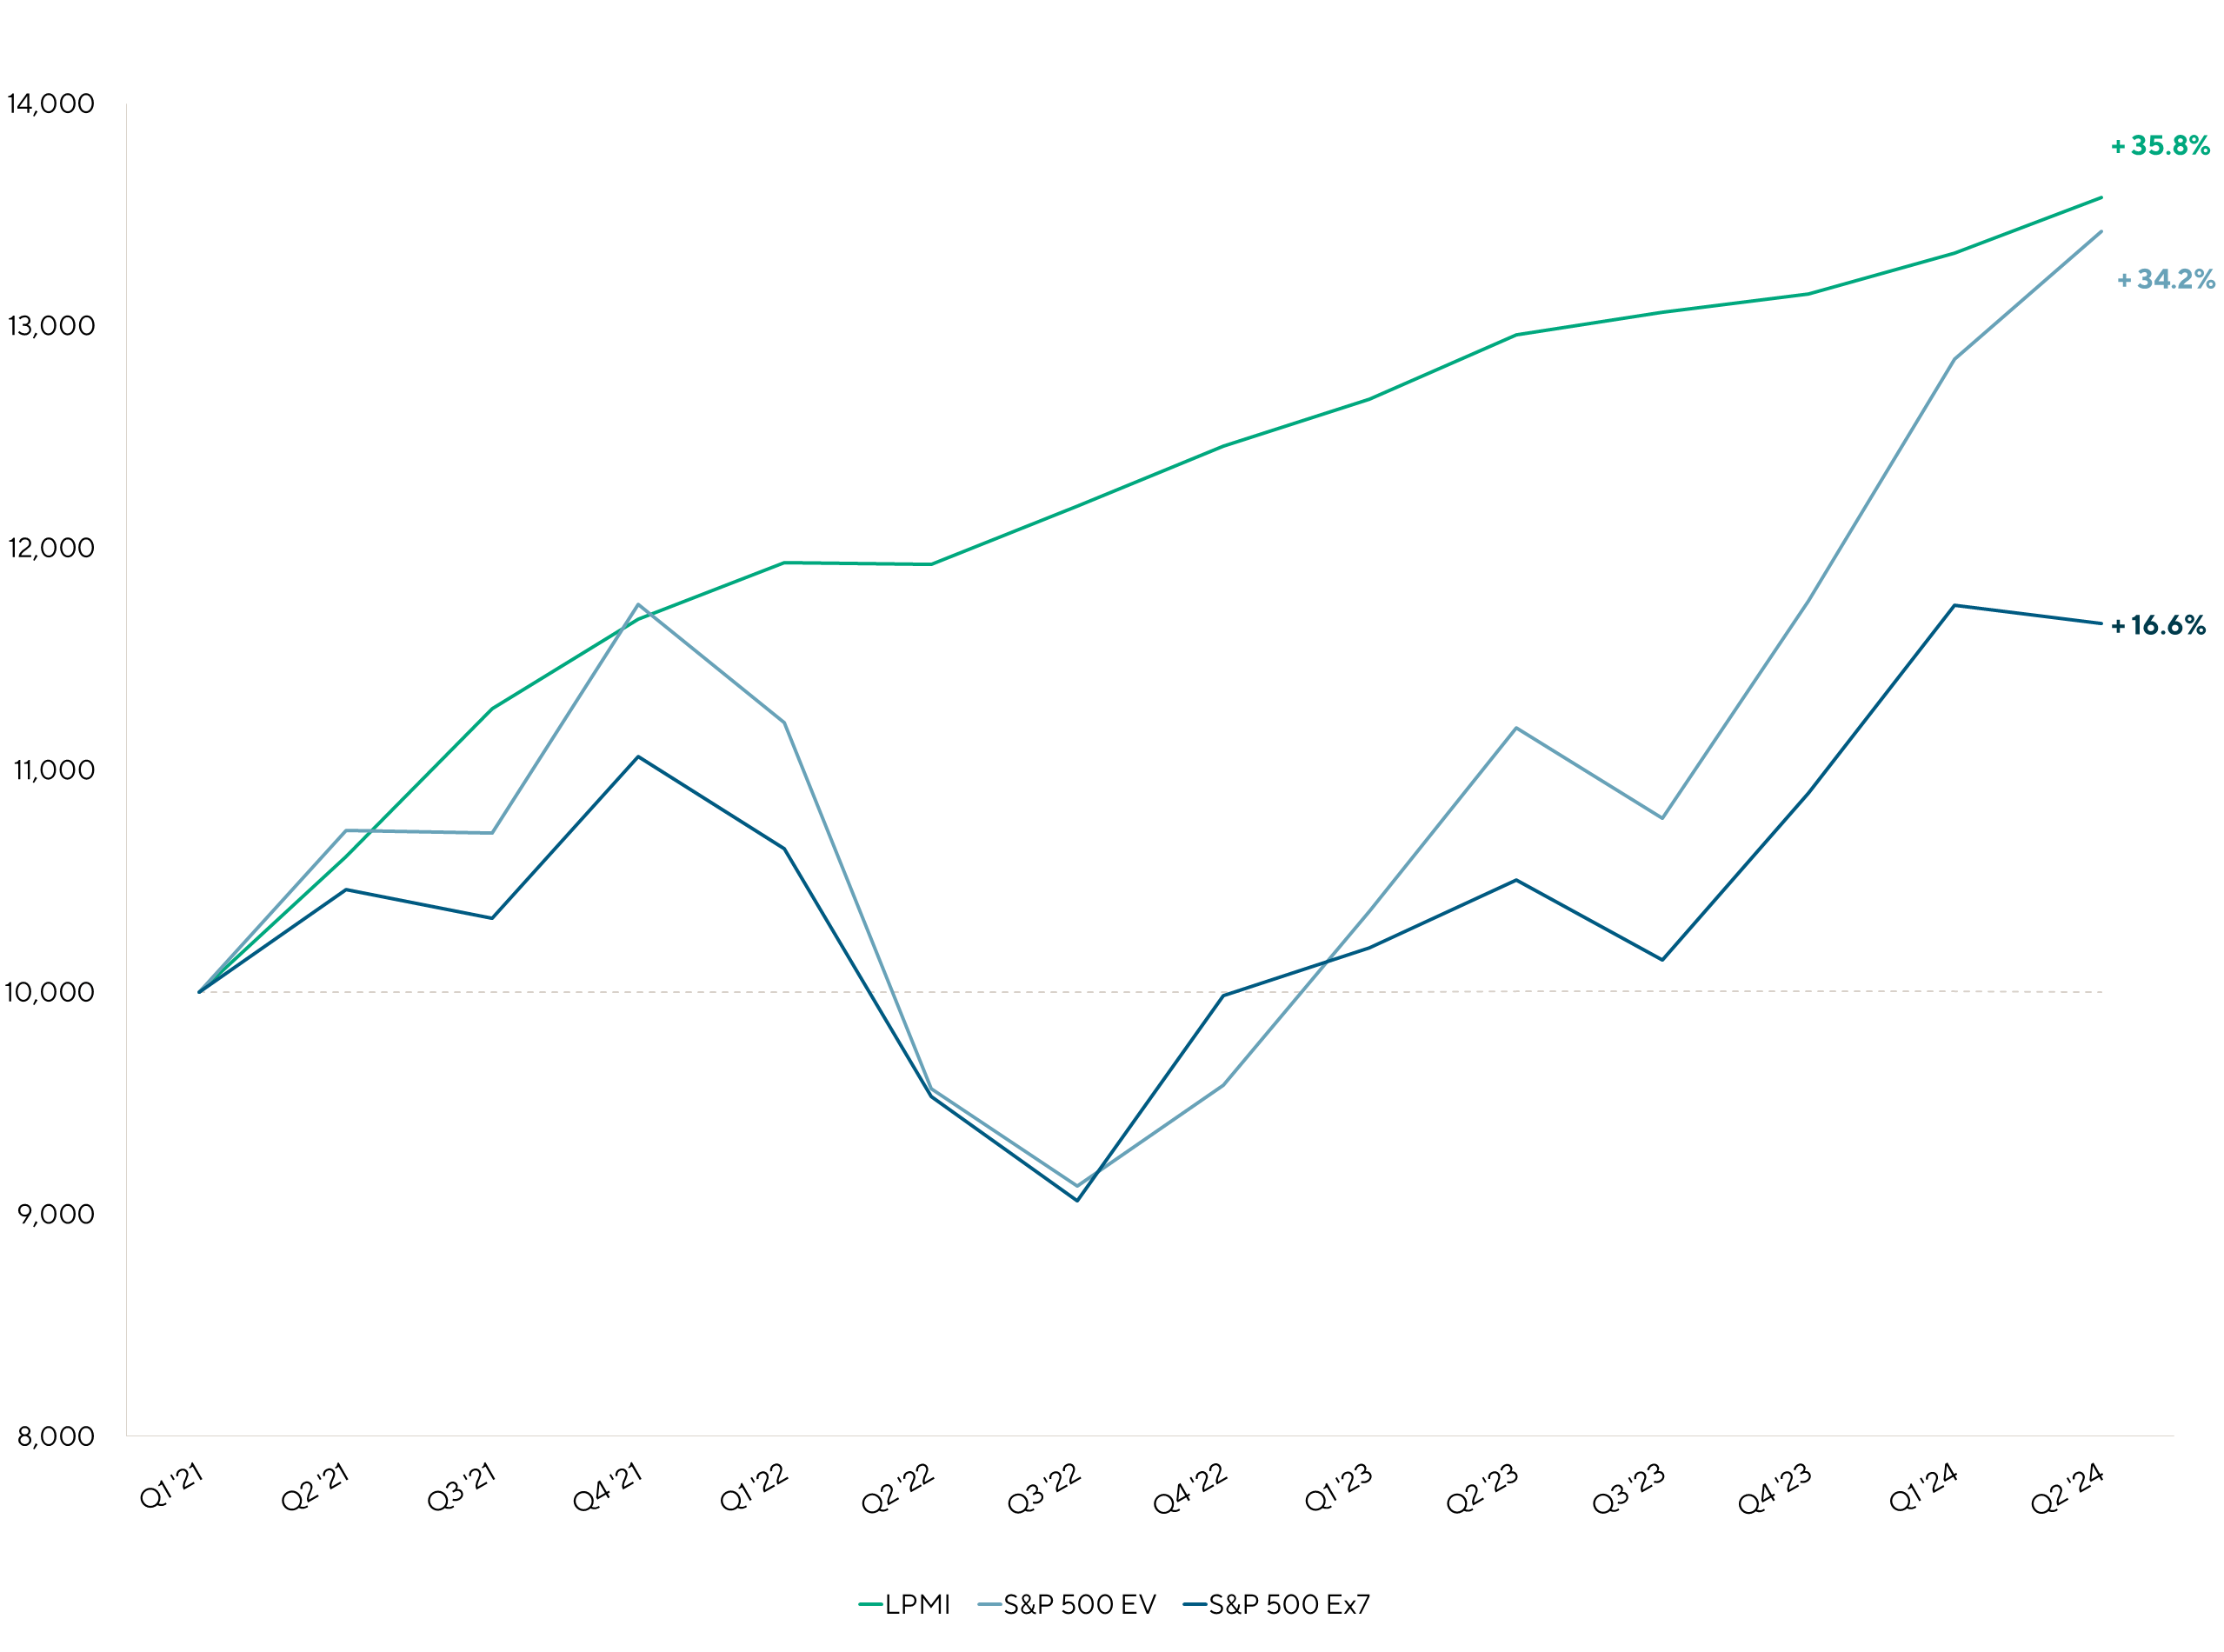
(NOTE:All three indices above represent enterprise values, including the public market indices)
(S&P 500 EV excludes financial companies for which enterprise value is generally not meaningful; however, including such companies produces similar results)
(S&P 500 Ex7 represents the S&P 500 EV index after excluding the “Magnificent Seven” of Alphabet, Amazon, Apple, Meta, Microsoft, Nvidia, and Tesla)
| Q2 ’24 | YTD | LTM | CAGR Since Inception | |
| LPMI | 1.9% | 3.3% | 4.8% | 7.6% |
| S&P 500 EV | 4.5% | 14.1% | 20.0% | 10.0% |
| S&P 500 Ex7 EV | (0.7%) | 7.0% | 11.0% | NA |
Sector Breakdown
Consumer companies’ valuations remain stable, but performance growth slows
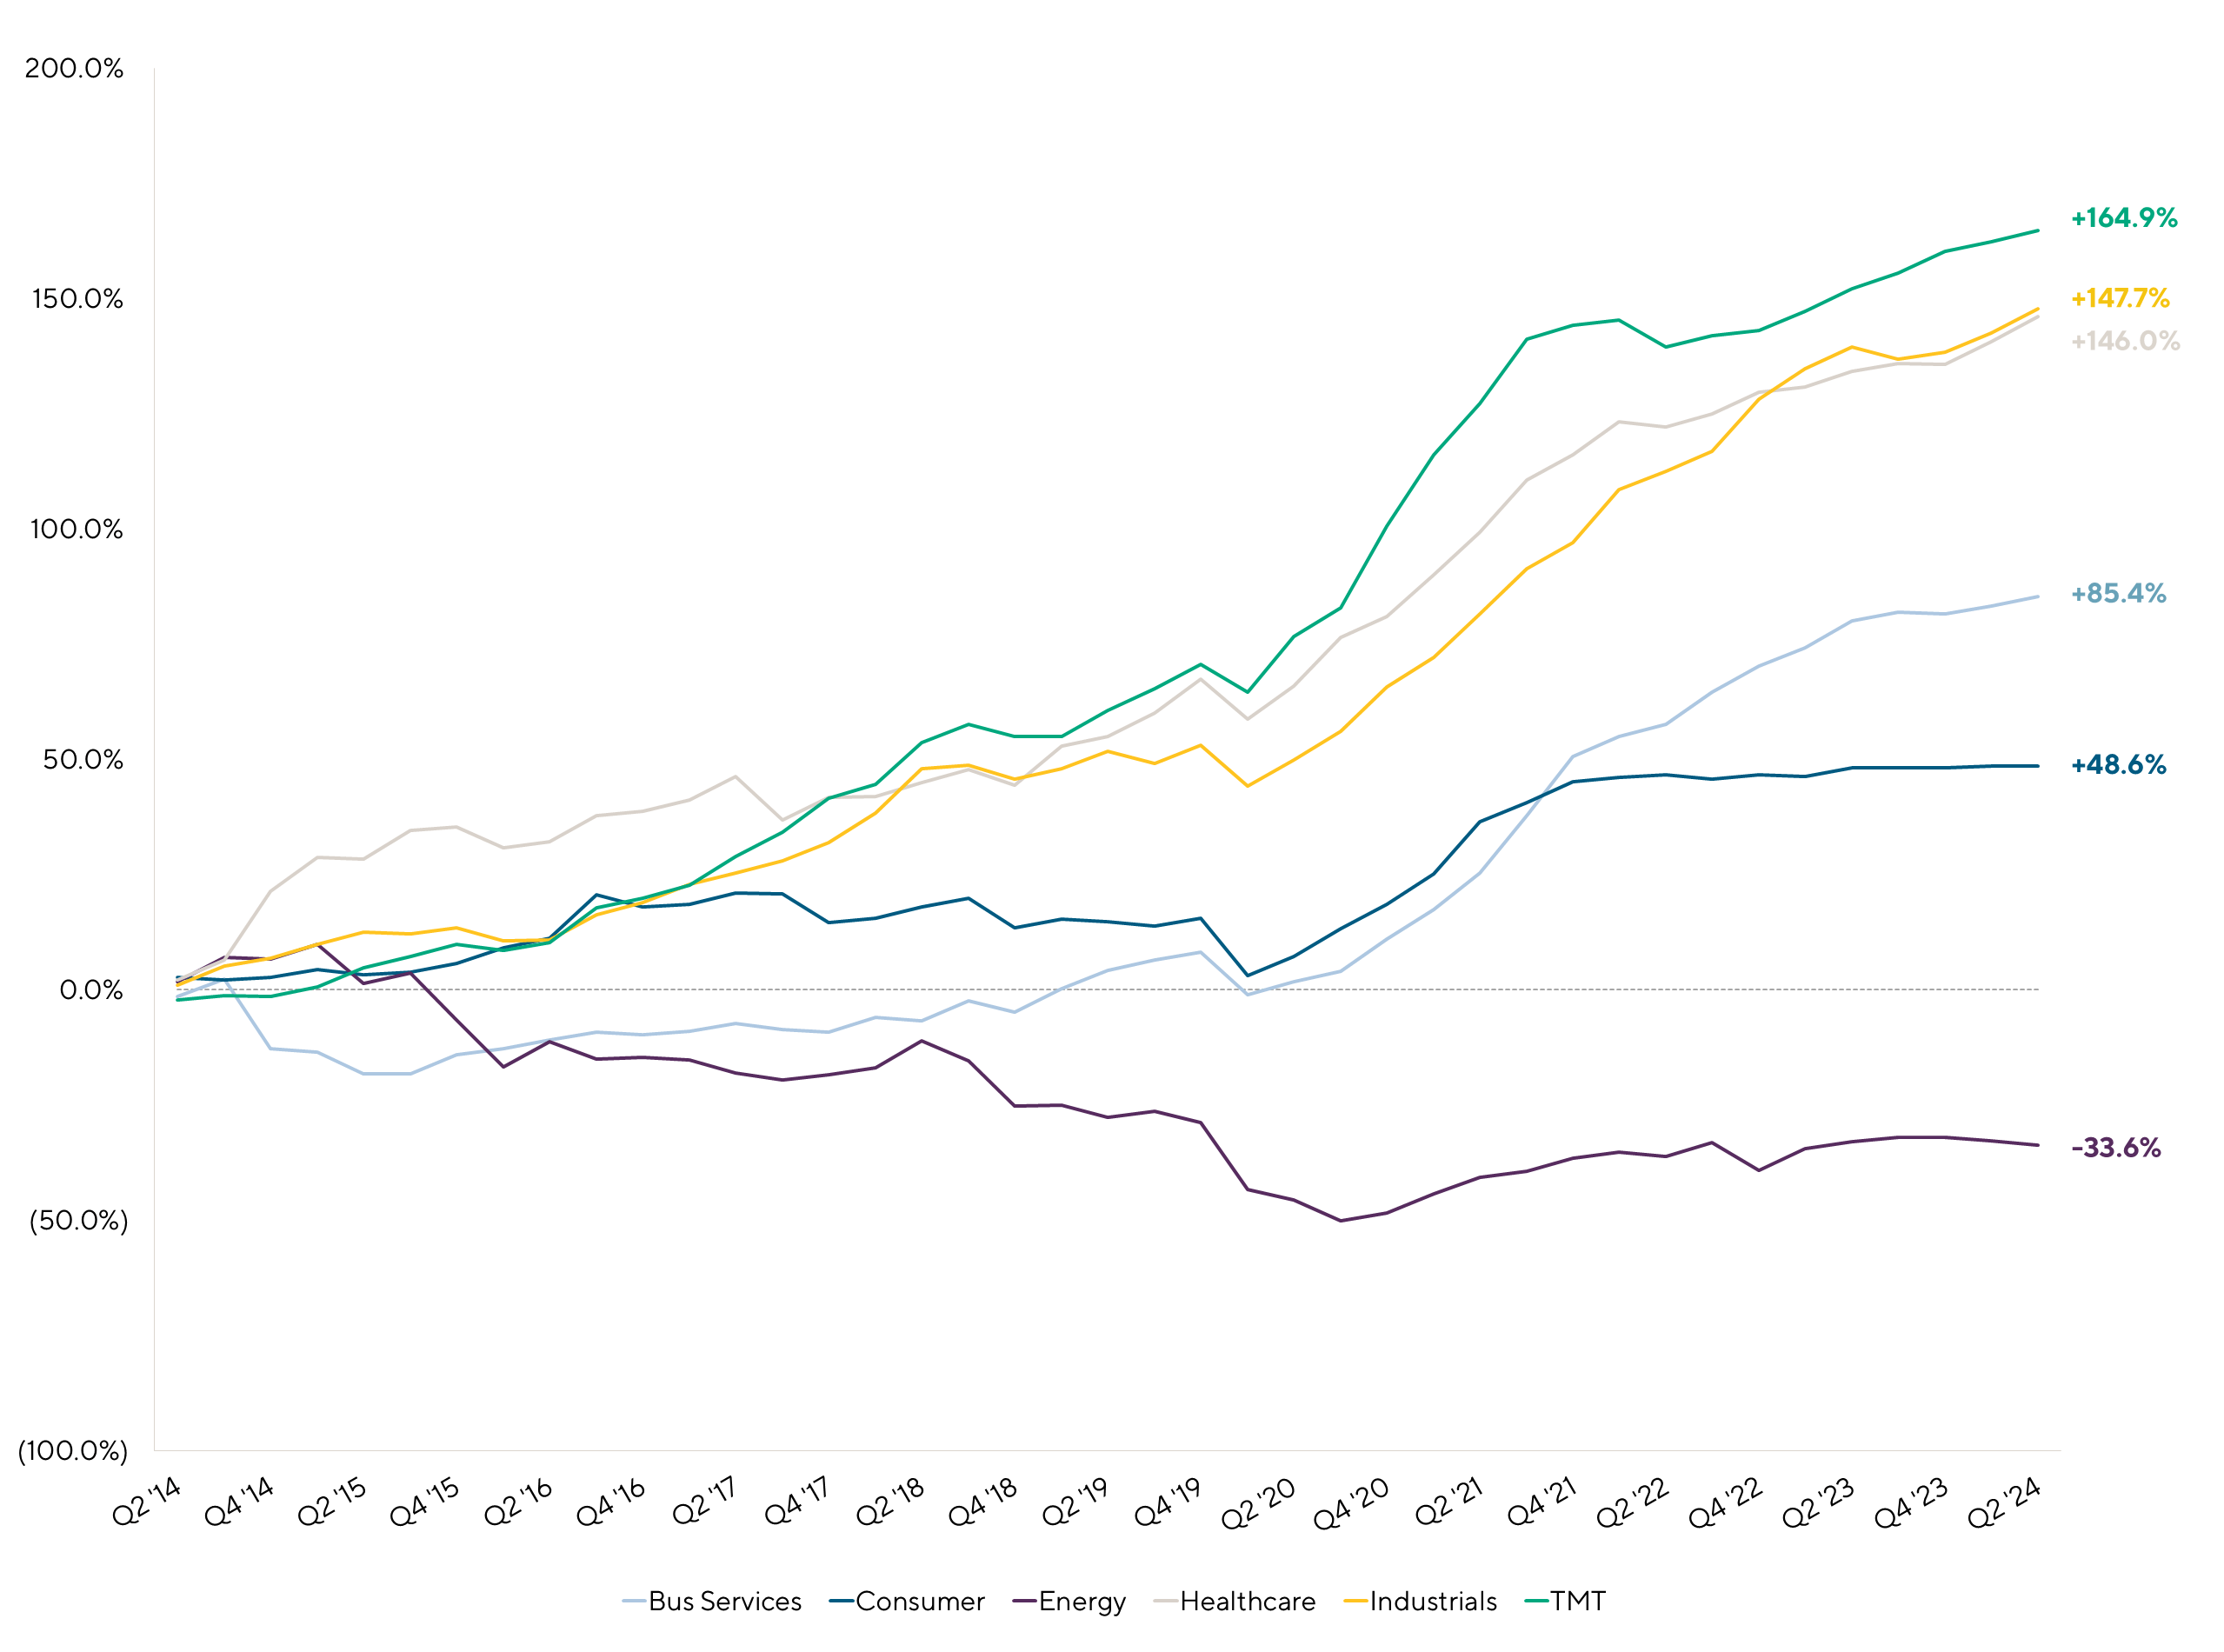
| Industry | Q2 ’24 | YTD | LTM |
| Business Services | 1.1% | 2.0% | 2.9% |
| Consumer | 0.1% | 0.4% | 0.4% |
| Energy | (1.4%) | (2.4%) | (1.0%) |
| Healthcare | 2.3% | 4.4% | 5.1% |
| Industrials | 12.1% | 4.0% | 3.4% |
| TMT | 1.0% | 1.8% | 5.1% |
| ~45%+ |
| Expansion of LPMI valuation multiples since Q2 2014 |
Examining the LPMI
Lower Middle Market vs Middle Market vs Large Corporate Sub-Indices
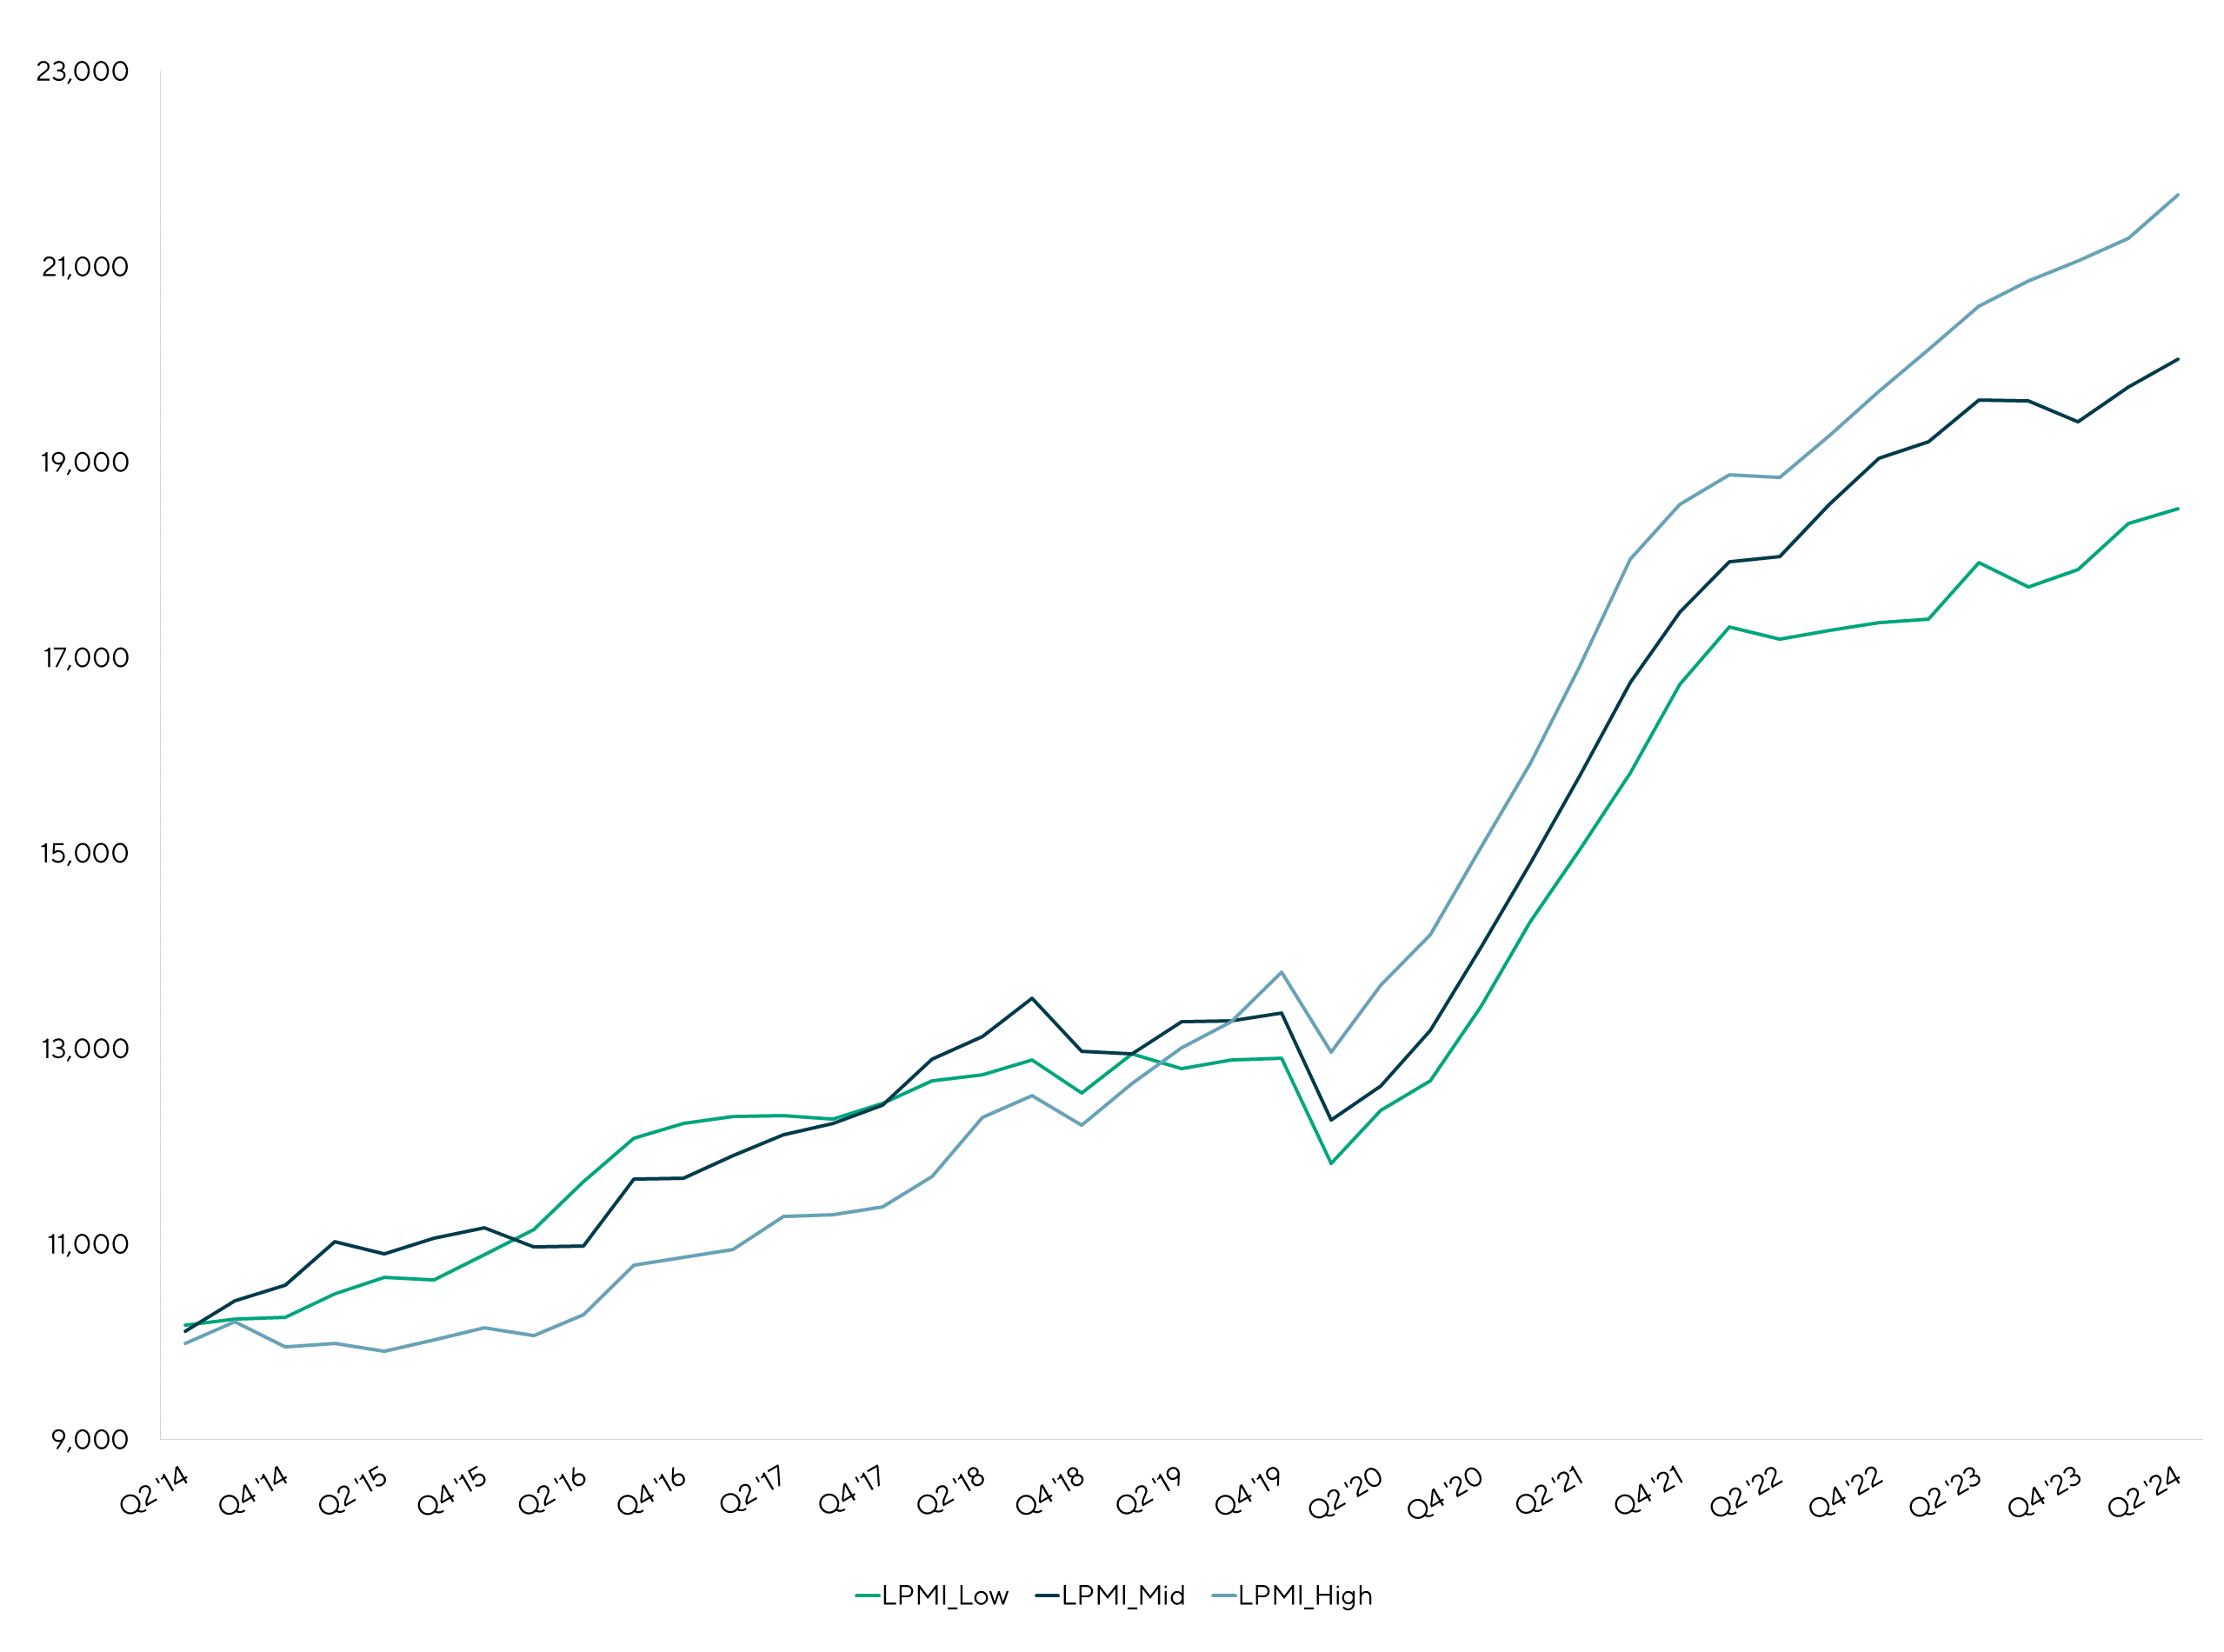
(Low is includes companies with LTM EBITDA <$20 million, Mid includes companies with LTM EBITDA of $20 million to $50 million and High includes companies with $50 million to $250 million)
For the second consecutive quarter, all size categories tracked by the Lincoln PMI grew in aggregate; however, the indices continue to see variability within performance trends and the movement of multiples.
Consistent with recent trends, smaller companies (i.e., those with less than $20.0 million of EBITDA) experienced the greatest earnings growth amongst all sub-indices. Despite this, investors tend to favor the stability found in larger companies as smaller companies often have greater exposure to customer concentration and less product diversification and therefore greater risk. The increased risk and lower appetite for smaller companies amongst investors has also led to more volatile multiples in recent periods as compared to larger companies who have benefitted from more stable valuation multiples and earnings.
Summary
The LPMI
General Observations
- Private company enterprise values increased for the eighth consecutive quarter as the Lincoln PMI increased 1.9%, driven by improved earnings.
- The S&P 500 enterprise values grew more than the Lincoln PMI in Q2 2024 thanks to the Magnificent 7 as the S&P 500 would have declined if the Magnificent 7 were excluded, which represents a more meaningful comparison to the private markets and thus the Lincoln PMI’s results.
- Since its inception in Q1 2014, the Lincoln PMI has shown that private company enterprise value multiples have been less volatile than public company multiples and that earnings are the primary factor driving long term value creation.
Enterprise Value Results
- Buyout activity remained muted in the first half of 2024; however, increased competition amongst lenders and tighter spreads could be the jolt needed to turn the tide on M&A activity in the latter half of the year.
- While the percentage of companies experiencing growth slowed for the first time since Q3 2023, the magnitude of EBITDA growth remained strong and approximated recent growth rates.
- Despite smaller companies’ earnings growth, they experienced the greatest degree of multiple contraction as investors remain comparatively risk-off and favor the stability of larger businesses as opposed to the growth prospects of smaller businesses.
Industry Breakdown on an Enterprise Value Basis
- Healthcare enterprise values improved despite regulatory uncertainty and reimbursement rate pressures.
- Consumer companies experienced the lowest performance and enterprise value growth as they continued to stave off sustained macroeconomic headwinds.
In Summary, we believe the LPMI
|
Methodology
Source of Data and Sample Size
On a quarterly basis, Lincoln determines the enterprise fair value of over 5,500+ portfolio companies for over 175 sponsors (i.e., PE groups and lenders to PE groups). These portfolio companies report quarterly financial results to the sponsor or lender. Lincoln obtains this information and determines the appropriate EV multiple so as to compute the EV in accordance with the fair value measurement principles of generally accepted accounting principles. In assessing EV, Lincoln relies on well-accepted valuation methodologies such as the market approach and income approach considering each company’s historical and projected performance and other qualitative and quantitative factors. Finally, each valuation is then vetted by auditors, company management, boards of directors and regulators. Upon concluding each quarterly valuation cycle, Lincoln aggregates the underlying financial performance and EV data for analysis.
To construct the LPMI, Lincoln selects a subsection of the companies valued each quarter, including private companies each generating earnings before interest, taxes, depreciation and amortization of less than $250.0 million, disregarding venture-stage businesses and non-operating entities, such as special purpose entities that own real estate and specialty finance assets.
For more information, visit www.lincolninternational.com/services/valuations-and-opinions/lincolnpmi
Independent Academic Validation of Lincoln’s Data
In January 2024, an Assistant Professor of Finance at Penn State University’s Smeal College of Business conducted a study to evaluate the statistical significance of Lincoln’s private market Database as compared to other independent sources, like Pitchbook, BDC Collateral, and Preqin. The test was akin to an FDA pharmaceutical drug effectiveness test wherein Lincoln’s data was tested in relation to the independent data sets, measuring overlap of deals detailed and congruency of reported terms. The results were robust and concluded that Lincoln’s data was representative of the private debt universe, and comprehensive of sponsor backed deals, in particular. Lincoln’s Database featured 53% of reported private debt deals with terms in Pitchbook and 48% of sponsor backed deals with reported debt terms that appeared in BDC Collateral. However, beyond the abundance of pure deals, Lincoln’s database goes a step beyond and includes vital operating performance figures from the portfolio company level that the other databases don’t feature. Lincoln’s data is more comprehensive, inclusive of enterprise value and financial performance metrics that allow for a much clearer picture of the state of the private markets.
| 5,500+ portfolio companies are evaluated by Lincoln on a quarterly basis to determine their enterprise fair value |
175+ sponsors participate in LPMI i.e. private equity groups & lenders to private equity groups |
Academic Advisors
Professor Steven Kaplan
Professor Steven Kaplan is a Senior Advisor to Lincoln’s Valuations and Opinions Group. He is the Neubauer Family Distinguished Service Professor of Entrepreneurship and Finance and Kessenich E.P. Faculty Director at the Polsky Center for Entrepreneurship and Innovation at the University of Chicago Booth School of Business. Among other courses, Professor Kaplan teaches advanced Master of Business Administration and executive courses in entrepreneurial finance and PE, corporate finance, corporate governance and wealth management. Professor Kaplan conducts research on a wide array of issues in private equity, venture capital, corporate governance, boards of directors, mergers and acquisitions and corporate finance. He has been a member of the Chicago Booth faculty since 1988.
Professor Kaplan serves on the board of Morningstar and several fund and company advisory boards. He is also a Research Associate at the National Bureau of Economic Research. He received a Bachelor of Arts, summa cum laude, in applied mathematics and economics from Harvard College and earned a Doctor of Philosophy in business economics from Harvard University.
Professor Michael Minnis
Professor Michael Minnis is a Senior Advisor to Lincoln’s Valuations and Opinions Group. He is the Charles E. Merrill Faculty Scholar and a Professor of Accounting at the University of Chicago Booth School of Business, where he researches the role of accounting information in allocating investment efficiently by both managers and capital providers. His recent research focuses on understanding the role of privately held companies in the U.S. economy and how these firms use financial reporting to access, deploy and manage capital. He particularly enjoys identifying unique data and methods to empirically examine issues in a novel way.
In January 2018, Professor Minnis became a member of the Private Company Council, the primary advisory council to the Financial Accounting Standards Board (FASB) on private company issues. Professor Minnis received his Ph.D. from the University of Michigan and his Bachelor of Science from the University of Illinois, where he graduated with highest honors.
Meet Our Senior Team


I find immense fulfillment in enabling clients to achieve their objectives and navigate the complexities of today's ever-changing landscape.
Chris Croft
Managing Director & Co-head of Transaction Opinions
New York


I enjoy sharing insights about market and valuation trends with my clients, while also leading a differentiated and high-touch process.
Brian Garfield
Managing Director & Head of U.S. Portfolio Valuations
New York
I enhance my clients’ decision making and governance processes by providing independent and objective financial advice in a highly responsive manner.
Chris Gregory
Managing Director & Co-head of Transaction Opinions
New York


I enjoy the opportunity to provide clients with insightful and unbiased advice that will help them make the most informed decisions possible.
Ron Kahn
Managing Director & Co-head of Valuations & Opinions
Chicago
Related Perspectives
IMPORTANT DISCLOSURE: The Lincoln Private Market Index is an informational indicator only, and does not constitute investment advice or an offer to sell or a solicitation to buy any security. It is not possible to directly invest in the Lincoln Private Market Index. Some of the statements above contain opinions based upon certain assumptions regarding the data used to create the Lincoln Private Market Index, and these opinions and assumptions may prove incorrect. Actual results could vary materially from those implied or expressed in such statements for any reason. The Lincoln Private Market Index has been created on the basis of information provided by third-party sources that are believed to be reliable, but Lincoln International has not conducted an independent verification of such information. Lincoln International makes no warranty or representation as to the accuracy or completeness of such third-party information.
The LPMI should not be construed as an offer to sell or buy, or a solicitation to sell or buy, any products linked to the performance of the LPMI. The use of the LPMI in any manner, including for benchmarking purposes, is not endorsed or recommended by Lincoln International and Lincoln International is not responsible for any use made of the LPMI. Lincoln International does not guarantee the accuracy and/or completeness of the LPMI and Lincoln International shall not have any liability for any errors or omissions therein. None of Lincoln International, any of its affiliates or subsidiaries, nor any of its directors, officers, employees, representatives, delegates or agents shall have any responsibility to any person (whether as a result of negligence or otherwise) for any determination made or anything done (or omitted to be determined or done) in respect of the LPMI and any use to which any person may put the LPMI. Lincoln International has no obligation to update the LPMI and has no obligation to investors with respect to any product based on the performance of the LPMI. Any investment in such a product will not acquire an interest in the LPMI. Lincoln International is not an investment adviser and will not provide any financial advice relating to a product linked to the performance of the LPMI. Investors should read any such product offering documentation and consult with their own legal, financial and tax advisors before investing in any such product.
© 2024 Lincoln Partners Advisors LLC. All rights reserved. LINCOLN PRIVATE MARKET INDEX and LINCOLN INTERNATIONAL are service marks owned by Lincoln Partners Advisors LLC and its affiliated entities. Any use of these service marks and these materials, including the reproduction, modification, distribution or republication of these materials, without the prior written consent of Lincoln International, is strictly prohibited.