2023: The Year of the Staredown Between Buyers & Sellers and the First to Blink
Dec 2023
Like a game of chess with a formidable opponent, 2023 has brought a veritable dealmaking stalemate. Record level private market transactions in 2021 and 2022 have been muted by macroeconomic and geopolitical headwinds – conditions not experienced in more than a decade. The uncertain backdrop has transformed an unprecedented market into a situation where both sides of the game table are working to outwit and outlast the other party.
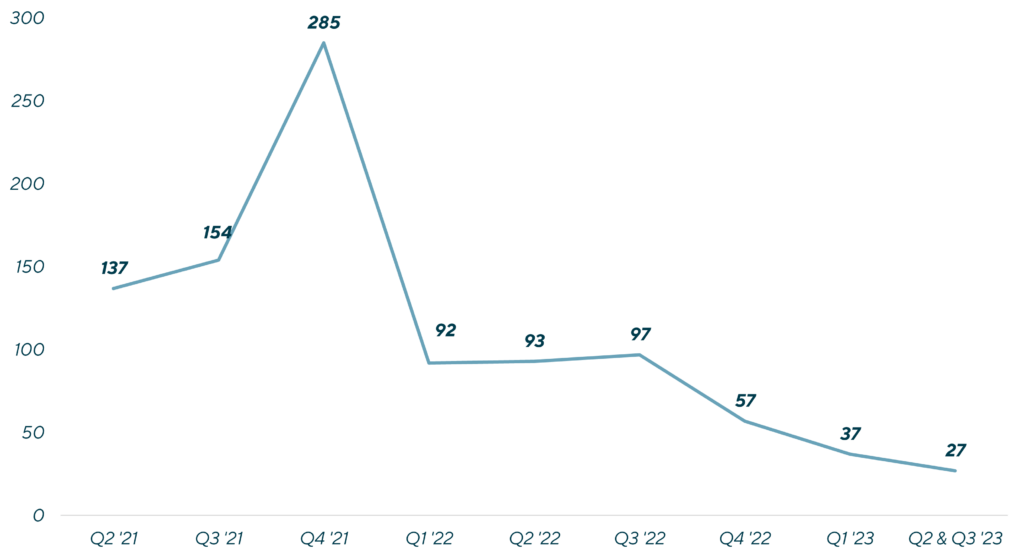
To explore whether one party might blink first, Lincoln International’s Valuations & Opinions Group dove further into this dearth of transaction activity, analyzing data compiled from its proprietary database of over 4,500 privately held companies, and has observed a significant decrease in new leveraged buyout transactions between Q4 2021 and late 2023.
In fact, year-to-date 2023 transaction volume by deal count is just about equal to the quantum of transactions observed in Q4 2022 alone. And while portfolio company performance and outlook certainly played a role, the more impactful cause to this slowdown in private market deal volume has been the rising interest rate environment.
Summary
-
Lincoln International’s Valuations & Opinions Group observes trends in data compiled from its proprietary database of over 4,500 privately held companies.
- Click here to download a printable version of this perspective.
- Sign up to receive Lincoln's perspectives
Lincoln Observed New Third-Party M&A BuyoutsSource: Lincoln VOG Proprietary Private Market Database |
The First Glance: Portfolio Company Performance Impact on M&A Activity
Fundamental performance plays a key factor in assessing the purchase price one is willing to pay for a portfolio company and if there were to be fundamental underperformance in the market, as measured by growth in revenue and earnings, buyers would be less attracted to such businesses.
However, on closer examination of portfolio company performance, it doesn’t appear that this is the reason for slower M&A activity in 2023.
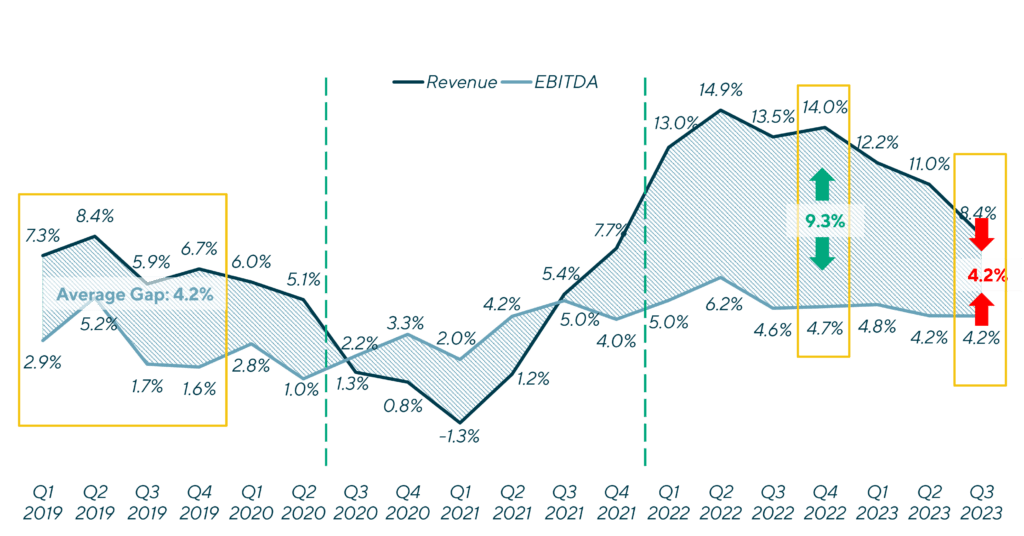
In fact, private companies continued to perform well in Q3 2023 as portfolio companies tracked by Lincoln’s proprietary database generated approximately 8.4% and 4.2% LTM YoY revenue and EBITDA growth, respectively. For some perspective, those figures compare to 7.3% and 2.9%, on average, dating back to Q1 2019. Similarly, as of Q3 2023, the percentage of companies that experienced year-over-year revenue and EBITDA growth was 72% and 61%, respectively and this too compares favorably to Q1 2019 when the percentage of revenue and EBITDA growers was 71% and 56%, respectively.
YoY LTM Revenue and EBITDA Growth MagnitudeSource: Lincoln VOG Proprietary Private Market Database |
While strong trailing performance is important, buyers look at not only how a company has performed in the past, but how it expects to perform in the future. At the outset of 2023, private companies projected both average revenue and EBITDA growth of approximately 10% and growth was anticipated across all industries, indicating that despite an array of headwinds, meaningful growth was still expected.
Through the first half of 2023, which is the latest reported data to date, 38% of private companies achieved the projected revenue growth and 48% achieved the projected EBITDA growth, but, notably much of the projected growth for the year is backend weighted. Despite this, based on a recent survey* conducted by Lincoln of over 100 private market professionals, there is optimism in the market as approximately 70% of respondents believe that revenue forecasts will be met or exceeded for 2023 and 60% of respondents believe that to be the case for EBITDA forecasts.
2023 H1 Actual Performance vs. Initial Budget Revenue Growth Expectations (% Magnitude of Growth)Source: Lincoln VOG Proprietary Private Market Database |
The Gaze Intensifies: If Fundamental Performance isn’t the Culprit, What is?
Throughout 2021 and the first half of 2022, SOFR, which is widely utilized as the base rate to finance sponsor-backed transactions, was at an all-time low level, hovering close to 0%. Back then, seemingly no one was anticipating the level of rates we are now seeing as a new norm. So, what did this mean for buyout transactions?
Companies were confident that low rates would persist and with the banner growth achieved during 2021 and 2022, were not expected to stop any time soon. Further, with equity cushions at favorable levels, the door opened for private creditors to extend higher leverage as compared to historical levels. Putting a finer point to it, in the low-rate environment, leverage reached as much as 7.0x in new buyout transactions, which compares to the historical average between 2018 and 2020 of approximately 5.90x, according to Lincoln’s database. And with higher leverage, in turn, purchase multiples also climbed. In fact, leveraged buyout multiples which historically averaged approximately 11.0x LTM EBITDA, increased to12.5x between 2021 and 2022 with some green shoots approaching ~20x, this according to Lincoln’s database. This party would soon come to an abrupt halt.
In March 2022, the Fed approved its first interest rate hike since 2018 and we were off to the races as the Fed proceeded to raise rates 10 more times after that initial hike. As the rate hikes persisted, the ability for private companies to attain leverage at +6.0x levels dissipated, first slowly and then more rapidly. As the rate increases continued and more and more chatter built around rates remaining higher for longer, we entered today’s environment wherein buyout transactions have grinded to a halt with the exception of a select number of A+ assets and a plethora of add-ons at attractive multiples. All the while, spreads over SOFR on new direct lending issuances also widened out by approximately 100 basis points, further increasing the cost of borrowing for private companies.
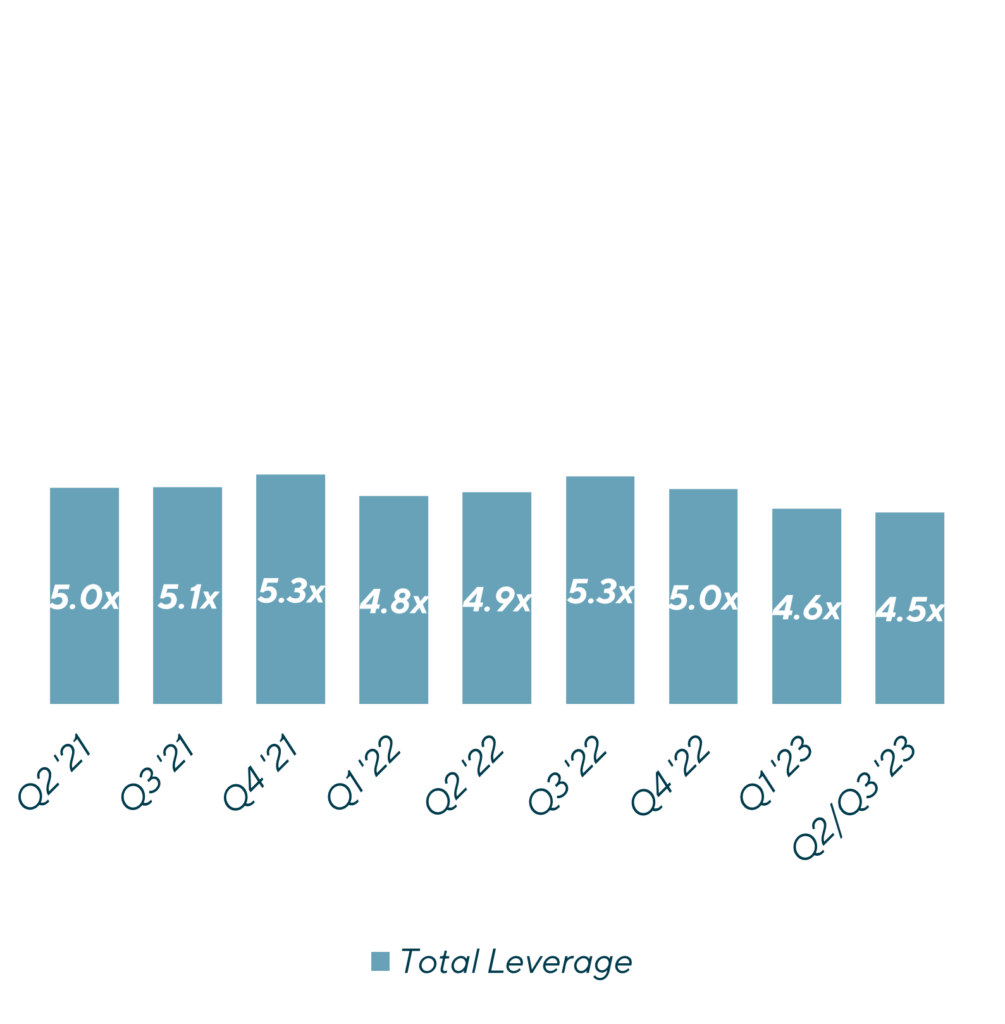
Source: Lincoln VOG Proprietary Private Market Database |
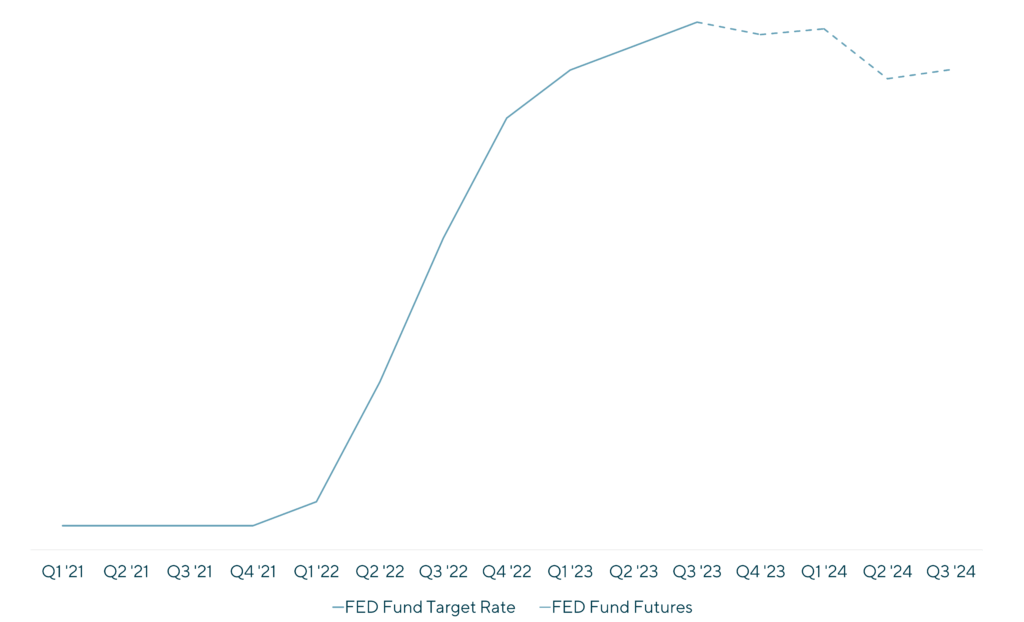
Source: FED Funds Futures per CME Group |
Unsurprisingly, there has been a high correlation between this increase in borrowing costs and the volume of transactions Lincoln has observed. As borrowing costs have risen, it has put stress on borrowers as EBITDA growth, albeit still healthy, has not been able to offset the rapid rise in interest rates, putting a strain on private companies’ cash flows. More specifically, Lincoln has observed fixed charge coverage decrease from 1.4x to 1.1x between Q1 2022 and Q3 2023. Additionally, 34% of companies had a fixed charge coverage ratio less than 1.0x in Q3 2023. Making matters worse, a full year of SOFR at 5.5% in the absence of any change in EBITDA would result in 41% of companies having a fixed charge coverage ratio less than 1.0x. To combat these pressures, private companies have had to pull back in other areas of spending such as capital expenditures, which have decreased 22% from Q3 2022 to Q3 2023. While these reductions in capital expenditures have created near-term breathing room, they could have long-term effects on future growth.
Reaching the Impasse: Will Buyers or Sellers Blink First?
The recipe for a slowdown in M&A activity is quite simple – pressures stemming from rising rates and general economic uncertainty have forced purchase prices into discovery mode. As a result, we have reached a buyer and seller stalemate. Sellers believe their prized assets are worth the prices seen during the top of the market in 2021 and early 2022, while buyers have reset their expectations around value due in large part to the constraints around debt financing.
The game of chess is ongoing. In the absence of 6x to 7x leverage, will buyers contribute additional equity so that sellers will accept the higher valuation levels they hope to achieve or will sellers bite the bullet and face a potential new reality that the higher rate environment has caused lower valuation levels? Or perhaps will LPs put pressure on GPs to sell their portfolio companies resulting in lower returns or will GPs feel pressure to deploy their ever growing dry powder although at a lower IRR expectation?
Looking Closer: What Do the Numbers Suggest?
72% of respondents to Lincoln’s recent survey indicated that alignment in valuation expectations between buyers and sellers will drive a return in M&A activity. And based on evidence from Lincoln’s proprietary database, it appears that the inflection point that valuations are indeed lower is slowly being digested by the market and sellers are starting to blink. As transactions that closed in the last two quarters have averaged 10.6x LTM EBITDA, this a decline from peak levels in Q4 2021 off 13.5x.
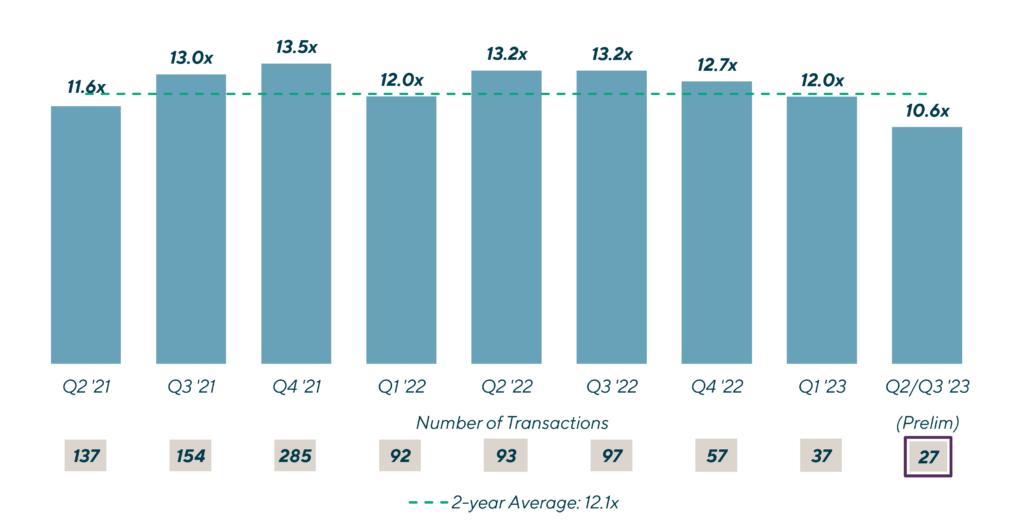 |
With sellers starting to relax their stare and valuation expectations begin to reset, the next question on everyone’s mind is when will M&A activity return en masse? According to Lincoln’s survey*, approximately half of respondents indicated that the second half of 2024 will be when the M&A floodgates reopen. So, if the respondents are indeed correct, for the foreseeable future, the staredown will continue and the A+ deals and add-on transactions will lead the muted M&A environment.
*Based on a Lincoln International poll of approximately 100 finance, valuations, and investment professionals in private equity and private credit.
Contributors

I find immense fulfillment in enabling clients to achieve their objectives and navigate the complexities of today's ever-changing landscape.
Chris Croft
Managing Director & Co-head of Transaction Opinions
New York
I enjoy sharing insights about market and valuation trends with my clients, while also leading a differentiated and high-touch process.
Brian Garfield
Managing Director & Head of U.S. Portfolio Valuations
New York
I enhance my clients’ decision making and governance processes by providing independent and objective financial advice in a highly responsive manner.
Chris Gregory
Managing Director & Co-head of Transaction Opinions
New York
I enjoy the opportunity to provide clients with insightful and unbiased advice that will help them make the most informed decisions possible.
Ron Kahn
Managing Director & Co-head of Valuations & Opinions
Chicago
