Lincoln International Middle Market Performance Review
Jun 2019
View original document from Pitchbook here. ![]()
Data provided by Lincoln International & Pitchbook
Lincoln MMI Results Summary | Pitchbook Results Summary | Comparison Analysis
Executive Summary
- Background
The Lincoln Middle Market Index (Lincoln MMI) is the only index measuring quarterly changes in the enterprise values of private middle-market companies. The Lincoln MMI is unique as it is the only private company fair value index based upon appraisals prepared congruent with fair value accounting and valuation principles. Consequently, as a fair value index, the Lincoln MMI enables a comparison to be made between private company financial performance relative to the performance of publicly traded firms. - Purpose
In order to provide a more conclusive analysis of PE performance relative to public markets, Lincoln utilized its latest MMI results in tandem with a similar study conducted by PitchBook. However, the underlying datasets analyzed were completely different; thus, with two separate, independent studies being utilized for the overall analysis, greater confidence in the findings of how PE stacks up against public markets’ performance is possible. - Key LMMI Findings
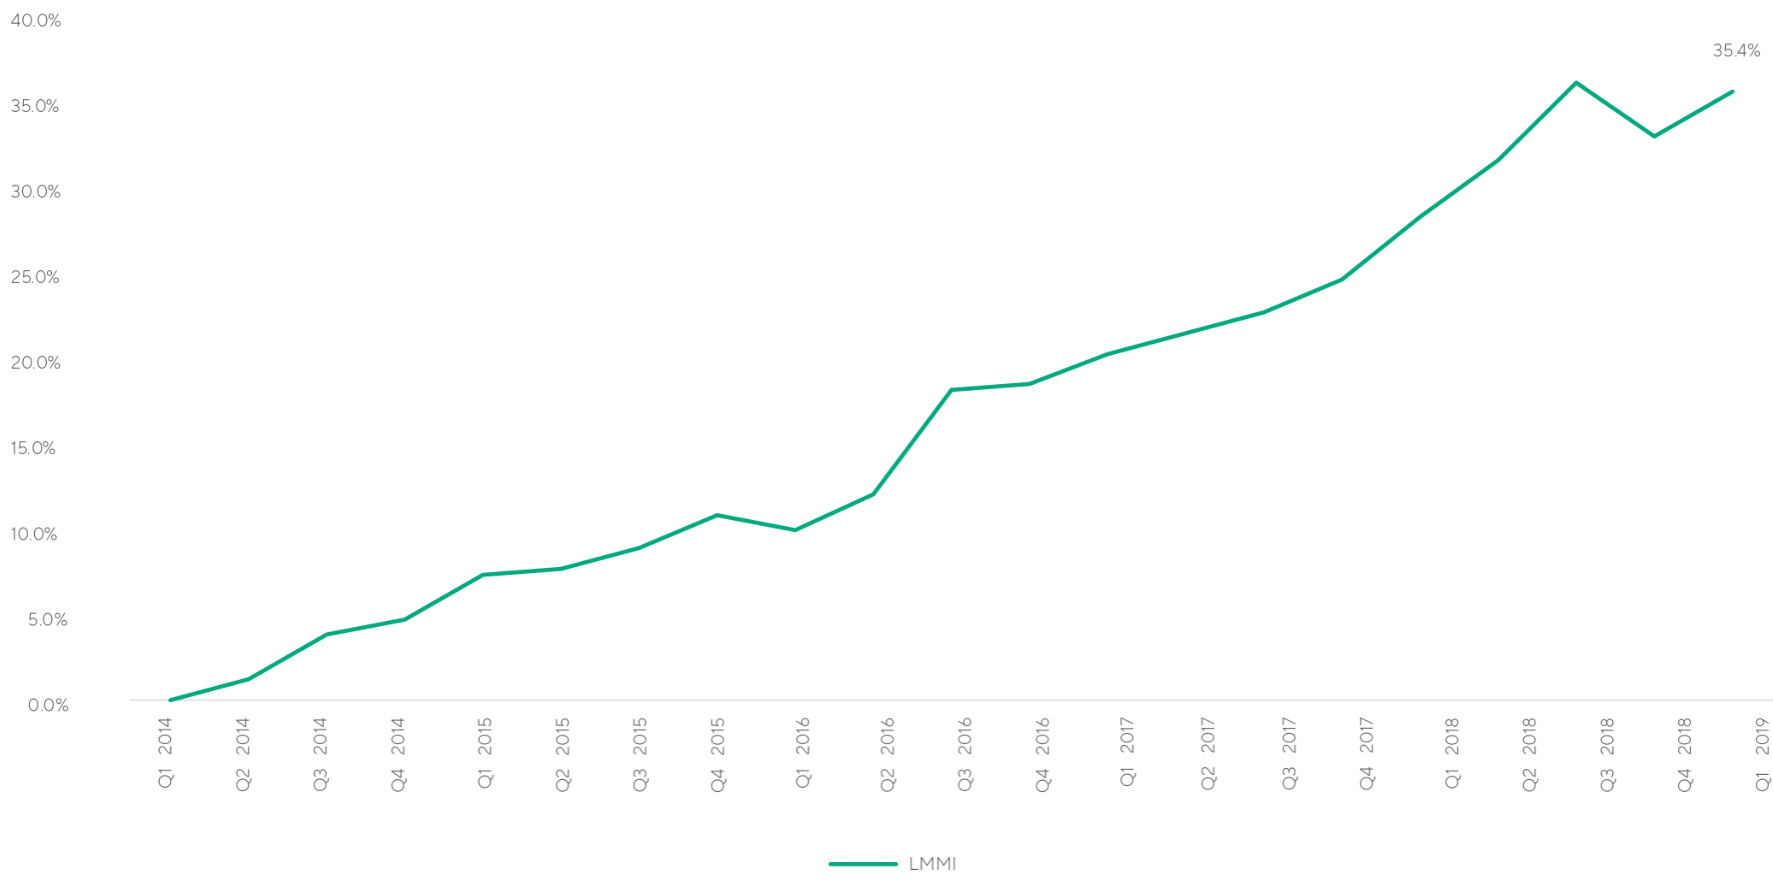
The Lincoln MMI most recent edition, 2019 quarter 1, increased 35.4% between the period March 31, 2014 to March 31, 2019. This growth rate exhibited much less volatility than the S&P 500 throughout that time. - Key Pitchbook Findings
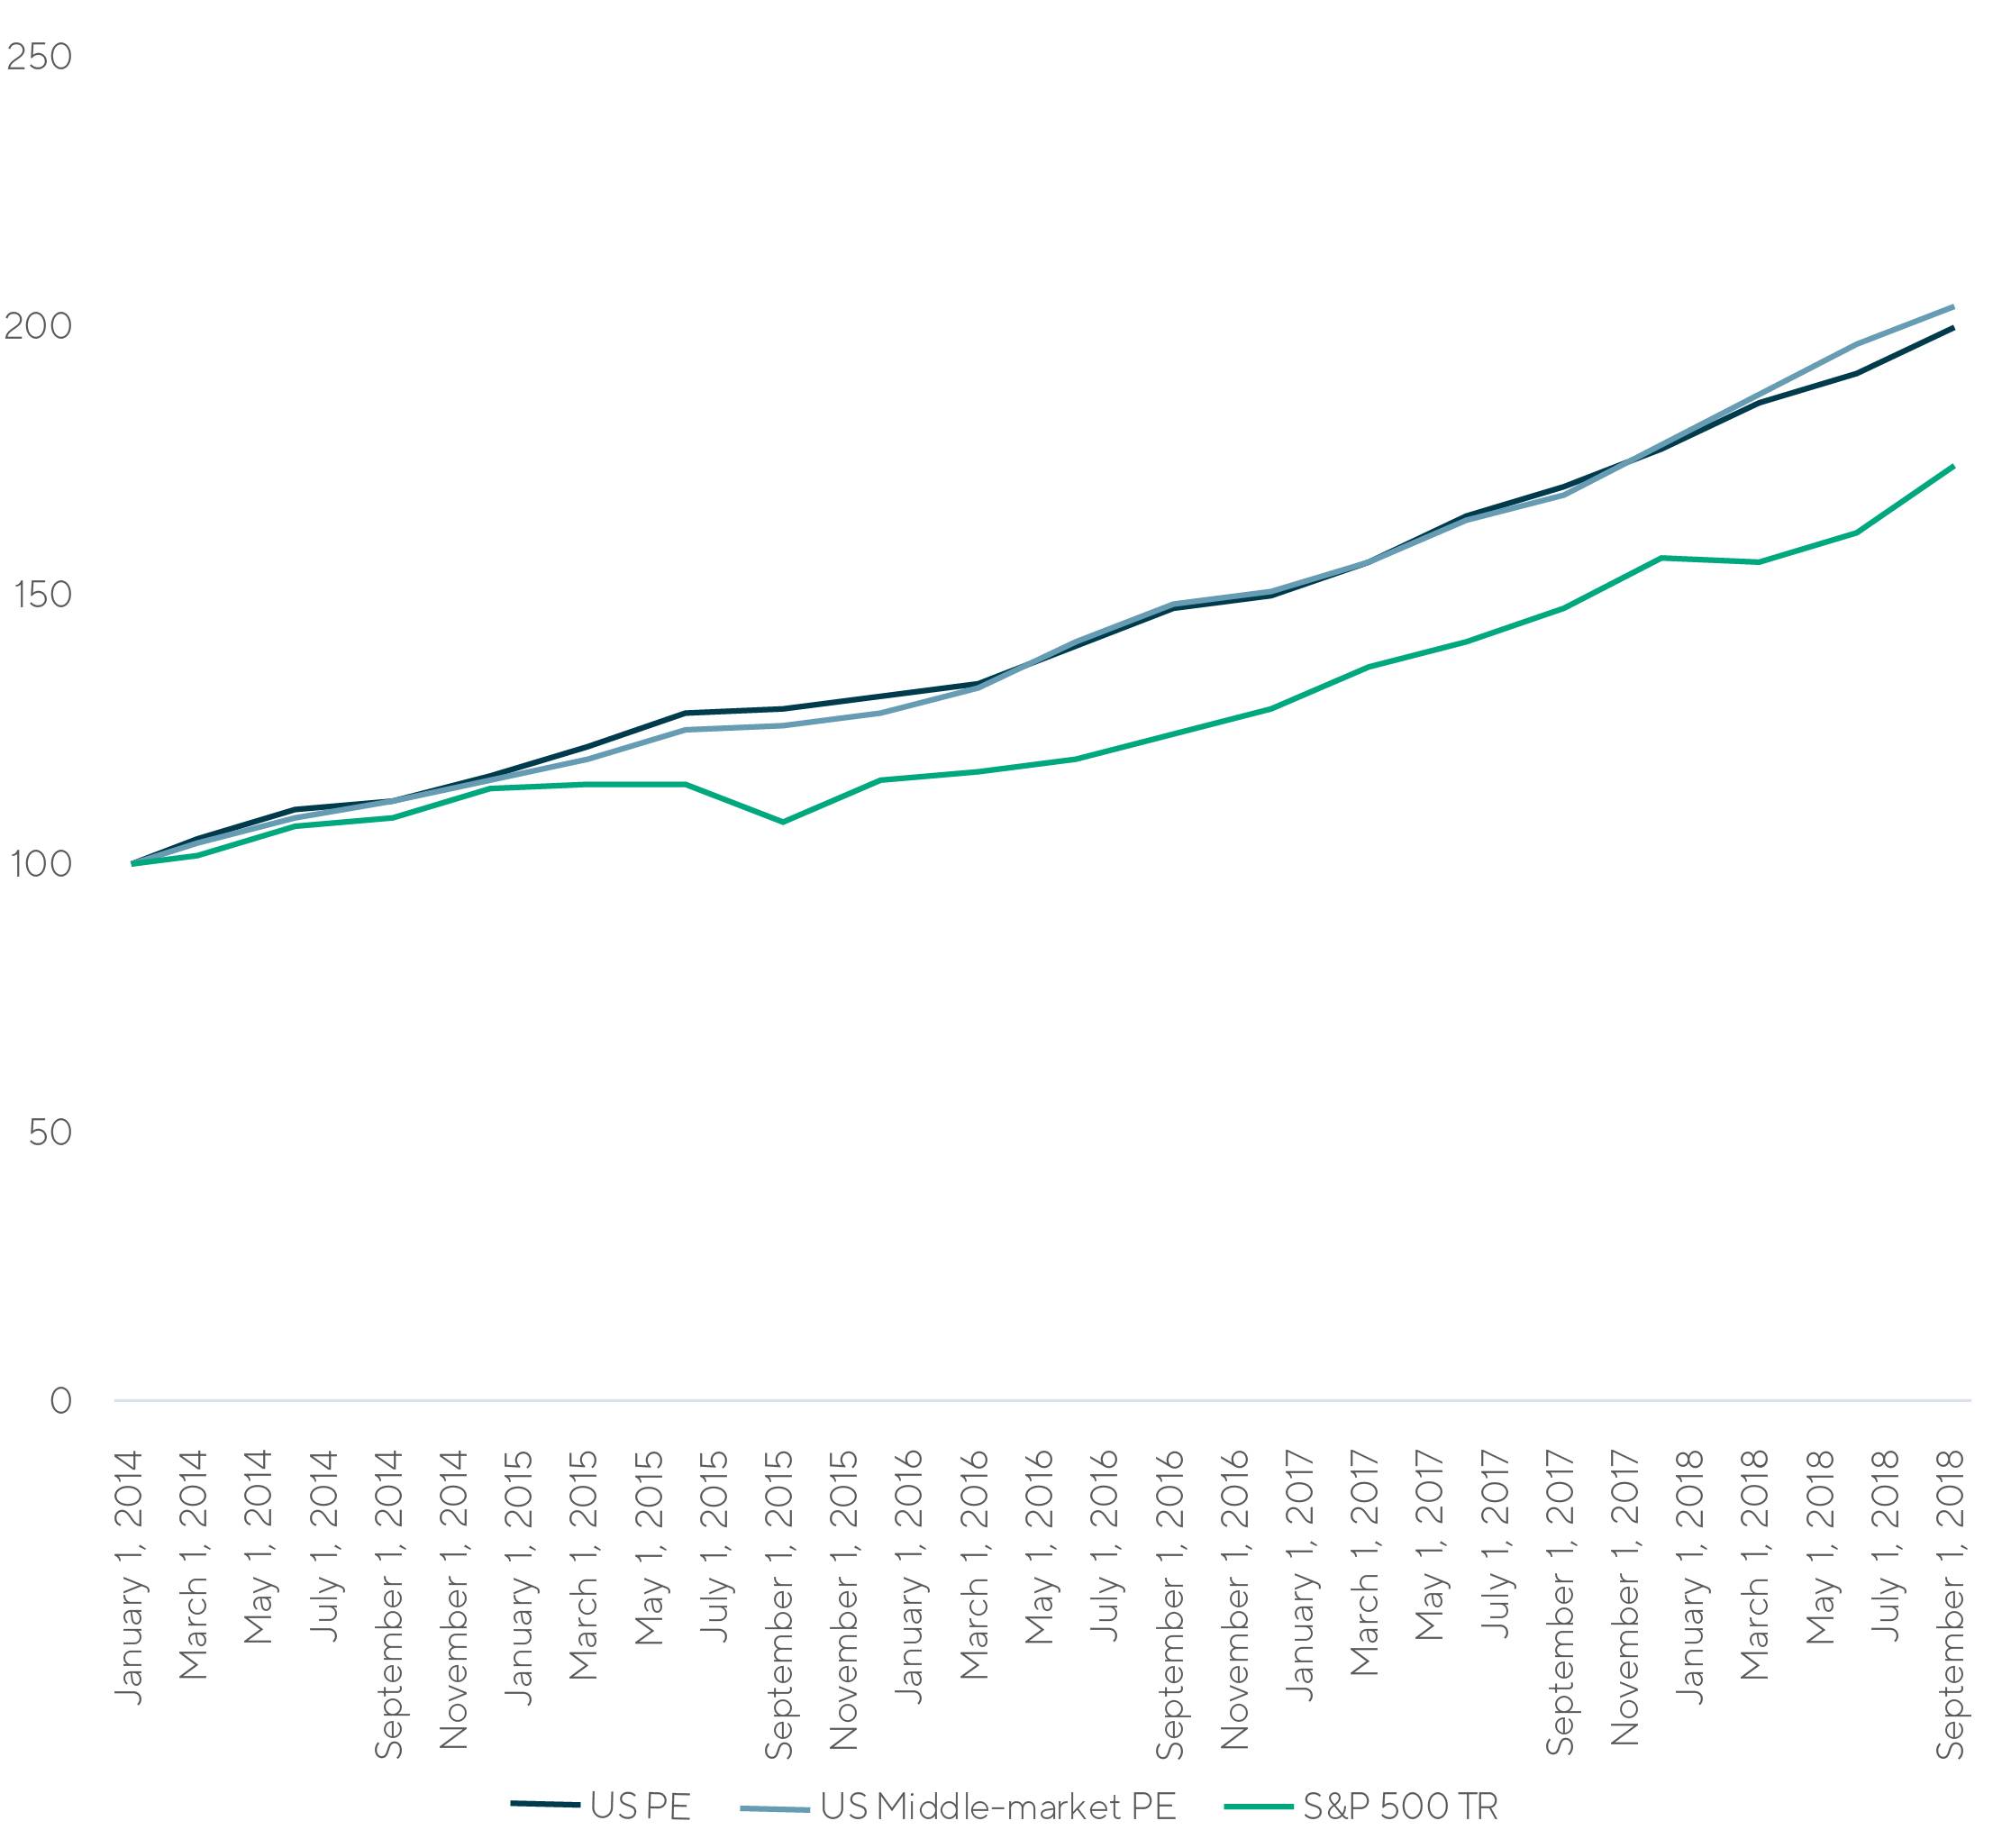
An independent study based on completely distinct PitchBook data yields an intriguing finding, with not only US PE but also US middle-market PE indices outperforming the S&P 500. - Key Joint Findings
Utilizing the separate studies, it is clear that private markets’ performance is not only less volatile than that of public markets, but also leverage can provide a much proportionately greater benefit for PE-backed companies. Last but not least, said growth is primarily due to increases in earnings.
Lincoln MMI Results Summary
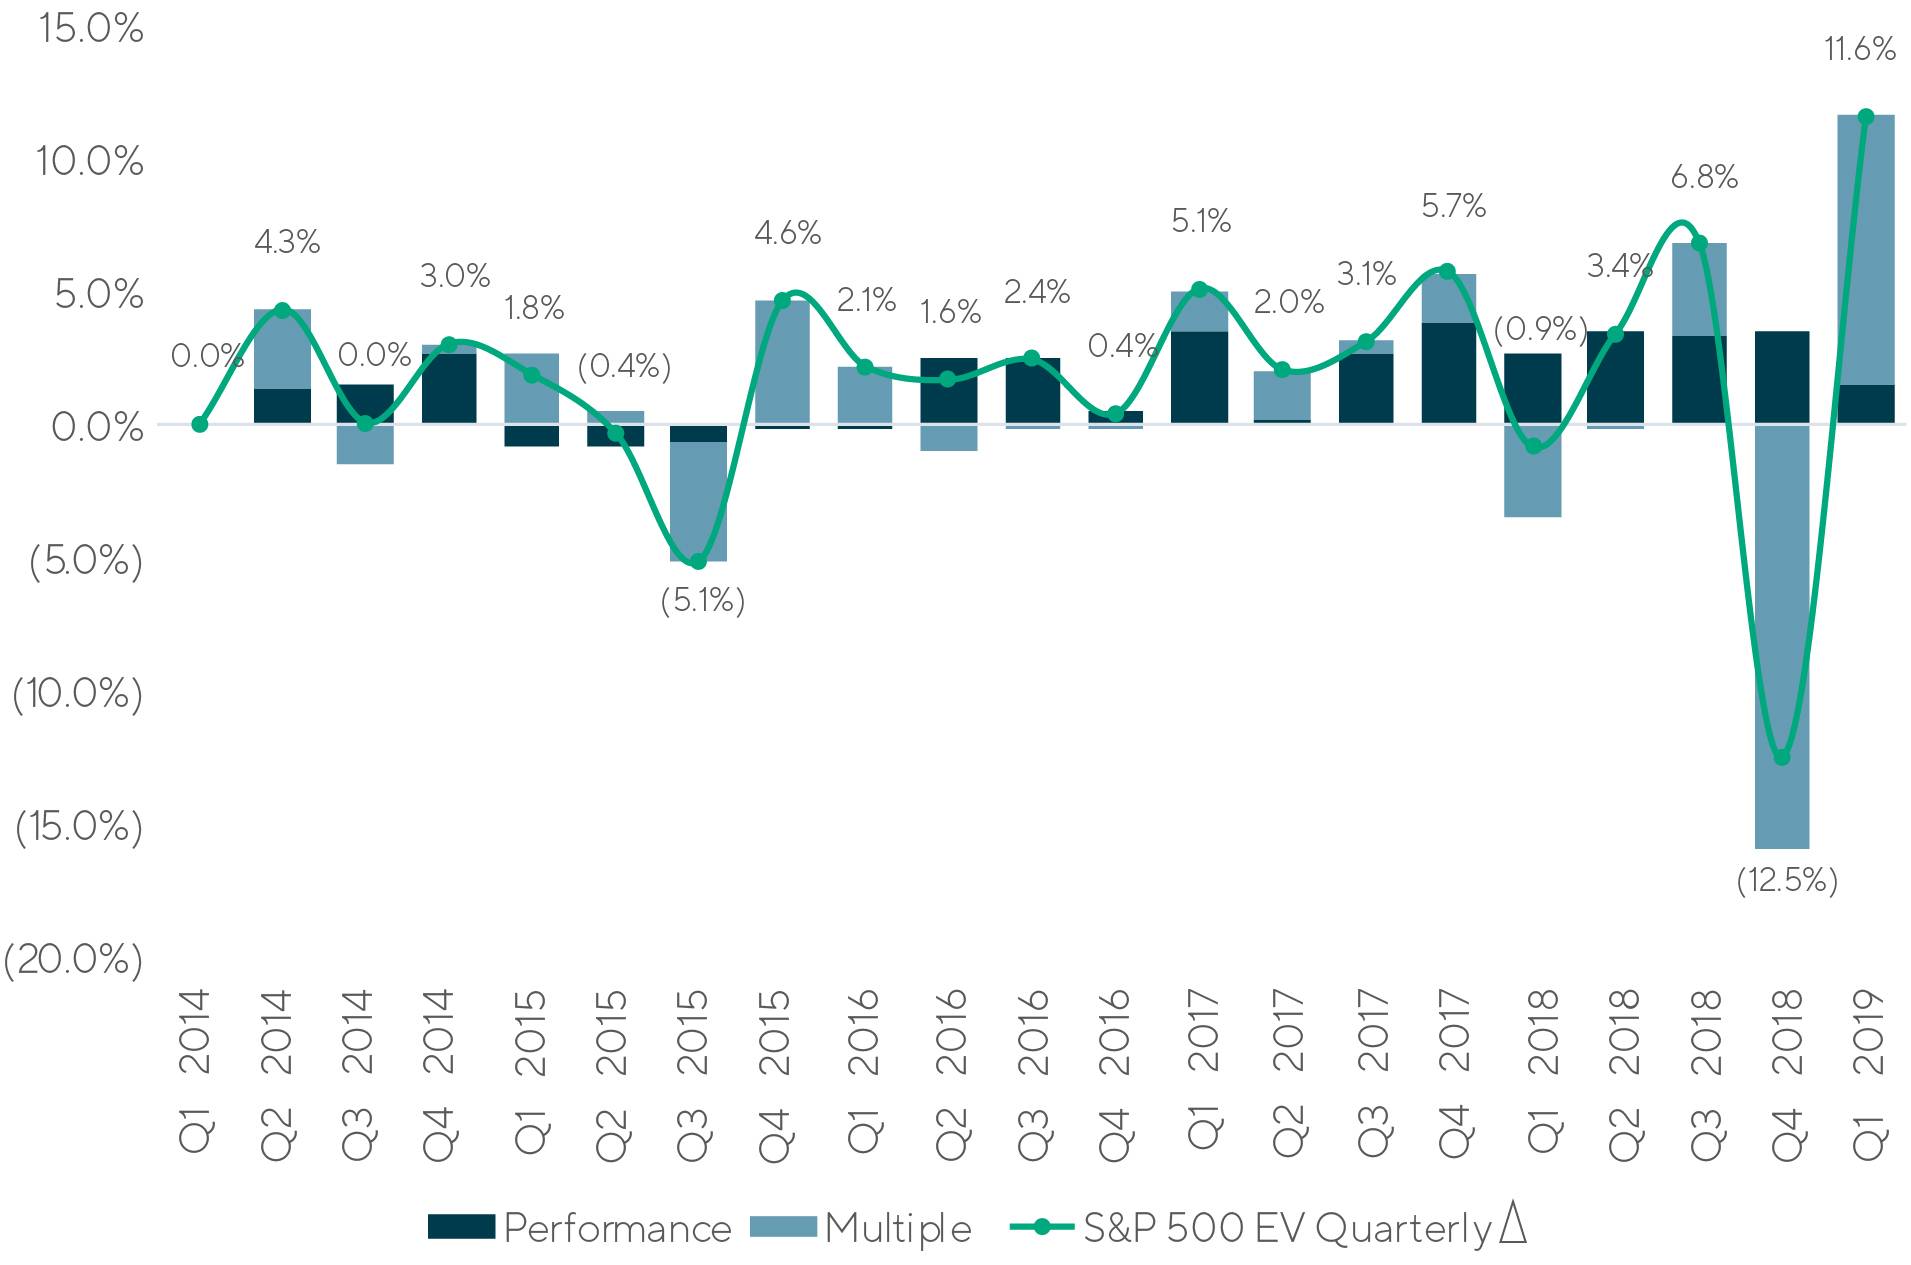
The latest edition of the Lincoln Middle Market Index (LMMI) reveals a remarkably strong growth trajectory for PE-backed companies over the past five years. From March 31, 2014 to March 31, 2019, the LMMI increased 35.4%. Most of this change can be attributed to changes in performance as measured by EBITDA, rather than increases in valuation multiples. Such a trend is in marked contrast to the S&P 500 over the same timeframe, which experienced much greater shifts in value due to multiples changing.
There are multiple factors at play causing this disparity. Private and public markets intrinsically differ; the price discovery mechanisms and volatility inherent in public markets can cause much more significant changes in valuation dependent on extrinsic factors, relative to the private markets. Beyond just earnings performance and other idiosyncratic factors, macro-economic events such as shifts in interest rates, regulatory policy changes (i.e., trade, banking, environmental, etc.) and many others impact supply and demand conditions. Therefore, macro-economic, industry and company specific factors influence how a company is valued. Regardless, for private markets, the quality of earnings is a much more significant factor impacting value versus public companies whereas in the public markets multiple volatility has a significantly greater impact on equity returns.

LMMI EV | Source: LMMI, Q1, 2019. The LMMI is an enterprise value, fair value index (i.e. EV equals fair value of equity plus interest-bearing debt).
Contextualizing the LMMI
The Lincoln MMI is unique as it directly measures the enterprise value of a population of PE-owned companies. The valuation methods applied are consistent with fair value accounting and valuation principles. Given the number of companies valued every quarter it is a representative sample of PE-sponsored company performance. However, to further test its results, we utilized PitchBook data to conduct another, completely different analysis. As the underlying datasets differ, testing PitchBook’s calculation of net asset value for US PE funds against the S&P 500 total return also would lend further evidence to the Lincoln MMI results, should they produce a similar result. As the above chart depicts, they definitely depict strong PE performance, with not only the US PE NAV index but also the US middle-market PE index handily outstripping the S&P 500 over the last several years. This is likely due to similar factors as discussed above; however, let’s examine performance drivers in greater depth.

US PE NAV vs. S&P 500 | Source: Pitchbook
Performance drivers in depth
Decomposing the sources of aggregate returns in greater depth
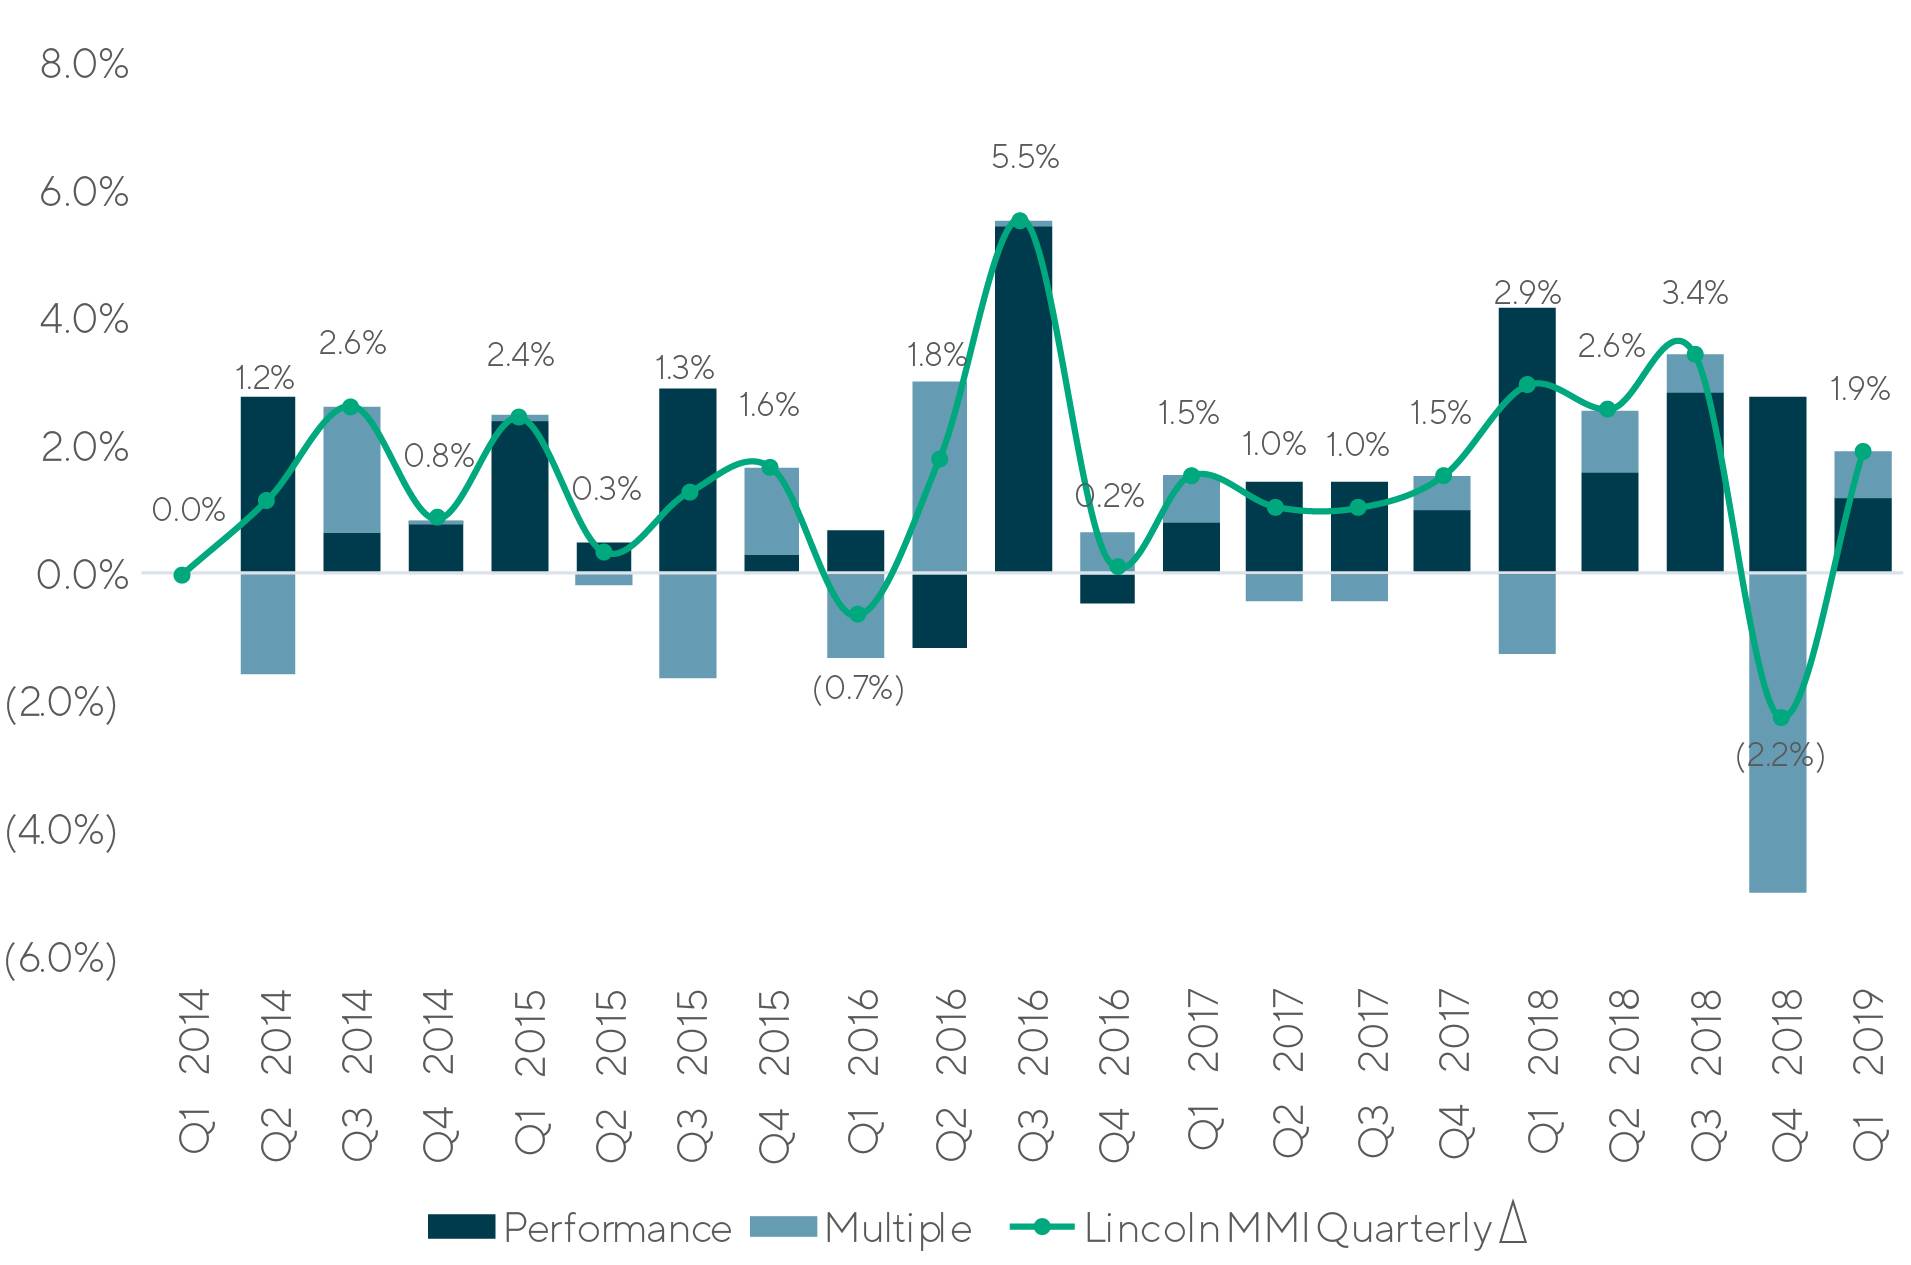
Breaking down performance into two key drivers, financial performance and EBITDA multiple, yields further insights. Since the start of 2017, financial performance has been positive for the Lincoln MMI, leading to a nearly unbroken string of quarters with positive delta overall for the index. Only the significant dip in multiples in the final quarter of 2018 dragged down performance. The S&P 500, on the other hand, owes a much greater percentage of its return performance to shifts in valuation multiples. One of the significant investment thesis of PE group ownership is eliminating company inefficiencies and implementing growth strategies. Time and time again PE groups have demonstrated their ability to grow company cash flow. The constituent company population within the Lincoln MMI are PE-backed portfolio companies. Empirical financial studies also support the conclusion that PE group ownership, on average, are successful in enabling the company to improve long-term cash flow. The Lincoln MMI confirms the ability of PE to create value.

LMMI drivers of performance by factor

S&P 500 EV drivers by factor
Conclusion
There are several benchmarks that provide performance indications of PE-backed companies. The results of the Lincoln MMI are consistent with other studies of PE performance, including PitchBook’s, in that:
- Private company returns are correlated to but less volatile than public company returns
- Leverage benefits shareholders of PE-owned companies to a much greater rate than as compared with public company returns
- Earnings growth is the primary factor creating increases in shareholder value
Summary
-
To construct the Lincoln MMI, Lincoln selects a subsection of the companies valued each quarter, including companies each generating earnings before interest, taxes, depreciation and amortization of less than $100.0 million, disregarding venture-stage businesses and non-operating entities, such as special purpose entities that own real estate and specialty finance assets. To determine equity value, Lincoln then reduces enterprise value by the face value of a company’s debt and debt-like balances. For example, for the sixth edition of the LMMI, Lincoln measured over 425 companies, based on a population of 1,400+ companies primarily owned by PE firms.
- Lincoln MMI enterprise value grew 35.4% from March 31, 2014 to March 31, 2019.
- Lincoln MMI performance has exceeded 1% each quarter since Q2 2017.
- Click here to download the full LMMI report
- Sign up to receive Lincoln's perspectives
Contributors

I enjoy the opportunity to provide clients with insightful and unbiased advice that will help them make the most informed decisions possible.
Ron Kahn
Managing Director & Co-head of Valuations & Opinions
Chicago
I am driven by the opportunity to provide accurate and thoughtful valuation services that help clients succeed and grow.
Patricia Luscombe
Managing Director & Co-head of Valuations & Opinions
Chicago
I enhance my clients’ decision making and governance processes by providing independent and objective financial advice in a highly responsive manner.
Chris Gregory
Managing Director & Co-head of Transaction Opinions
New YorkMeet our Senior Team in Valuations & Opinions

I find immense fulfillment in enabling clients to achieve their objectives and navigate the complexities of today's ever-changing landscape.
Chris Croft
Managing Director & Co-head of Transaction Opinions
New York
I enjoy sharing insights about market and valuation trends with my clients, while also leading a differentiated and high-touch process.
Brian Garfield
Managing Director & Head of U.S. Portfolio Valuations
New York
I enhance my clients’ decision making and governance processes by providing independent and objective financial advice in a highly responsive manner.
Chris Gregory
Managing Director & Co-head of Transaction Opinions
New York
I enjoy the opportunity to provide clients with insightful and unbiased advice that will help them make the most informed decisions possible.
Ron Kahn
Managing Director & Co-head of Valuations & Opinions
Chicago


